

Introduction
I had the opportunity to attend Tableau Conference 2025, and it was packed with exciting announcements, inspiring sessions, and a clear vision for the future of analytics. In this post, I’m sharing key takeaways that stood out to me, from Tableau’s evolution into a smart assistant to technical upgrades in Tableau Prep, new visualization options, and enhanced user experience. Whether you’re a Tableau power user or just curious about what’s coming next, I hope you find these insights helpful.

Key Takeaways
- Tableau Next
- Tableau Prep
- Tableau Marketplace
- Viz Extensions
- Design & Usability Enhancements
- Community Engagement & Events
Watch TC25 sessions on Salesforce+.

1. Tableau Next: A New Era of Agentic Analytics
One of the most exciting themes of the conference was Tableau Next—a vision for turning Tableau into a proactive, intelligent assistant that supports users across the entire data journey.
At the heart of this vision is Agentic Analytics, which leverages AI-powered agents to handle tasks like data prep, natural language interaction, and alerting users to key changes.

Key Concepts:
🤖 Agentic Analytics: AI agents assist throughout the data journey
🧠 Data Pro: AI assistant for data prep
💬 Concierge: Ask data questions in natural language
🔍 Inspector: Monitors data and flags anomalies or trends proactively
🔗 Semantic Layer: Bridge raw data with business-friendly terms, ensuring AI outputs are accurate and contextual.
Why it matters:
- Get insights faster
- Less manual work
- Easier for everyone to explore data
What to Know About Tableau Next: FAQ
.png")
2. Tableau Prep: Now More Scalable and Cloud-Friendly
Big news for Prep users: In-Database Processing is now supported in Tableau Prep. This means Tableau can now push transformations directly to the database, instead of pulling all data into memory.

Why this matters:
- Significantly better performance on large datasets
- Reduced cloud data transfer costs
- More scalable workflows for enterprise environments
Other upgrades include:
- Custom Python Scripts on Tableau Cloud: Run Python logic directly in the cloud as part of Prep flows
- Prep Output to Google Drive: Export your output files to Google Drive for easier access and sharing
These are major quality-of-life improvements for data engineers and analysts working at scale.
3. Tableau Marketplace (aka Tableau Exchange)
Think of the Tableau Marketplace as an app store for Tableau. It’s where users can find tools, connectors, and extensions to enhance what Tableau can do—without reinventing the wheel.

Key offerings:
- Dashboard Extensions: Add advanced filters, natural language explanations, etc.
- Connectors: Pull in data from sources not natively supported
- Accelerators: Prebuilt dashboards for specific industries or use cases
- Viz Extensions (Beta): Add new chart types beyond Tableau’s native capabilities
If you’ve ever thought “I wish Tableau could do X,” there’s a good chance the Marketplace has a solution.
4. Viz Extensions: Unlock New Visualization Types
One of the coolest features announced was Viz Extensions, currently in beta. These allow you to embed advanced charts like Sankey diagrams, radar charts, or network graphs—right inside Tableau.

These extensions are interactive and integrate seamlessly into dashboards, giving you more flexibility to tell the right story visually. Perfect for teams needing to go beyond the standard bar and line charts.

Tutorial: Add Viz Extensions to Your Worksheet
During one session, I created this Sankey chart using a Viz Extension. Normally, this type of chart is complex and requires a lot of data prep—but with Viz Extensions, it was simple: drag, drop, and done.


5. Design & Usability Enhancements
Tableau continues to polish the user experience with several impactful UI upgrades:
Rounded Corners
Add rounded edges to dashboard objects for cleaner, modern design

Custom Color Palettes (AI-Assisted)
Use generative AI to create palettes from natural language prompts

Map Viewport Filtering
Dynamically filter dashboards based on what part of the map a user is viewing

Recycle Bin
Restore deleted projects, workbooks, and data sources for up to 30 days

These features reduce friction and open up new design possibilities without adding complexity.
Devs on Stage at Tableau Conference 2025
Blog: Devs on Stage
6. Community & Events: Learning Through Connection
The conference also highlighted Tableau’s vibrant community:
Tableau Doctor
One-on-one help from Tableau experts
I booked a Tableau Doctor appointment to ask about a real challenge from work: how to sort a Fiscal Month filter dropdown based on our company’s fiscal calendar. Since the Fiscal Month field is a calculated string, Tableau’s default sort options don’t allow sorting by another field. While the problem wasn’t solved, it was still a great experience to ask, learn, and connect directly with a product expert.
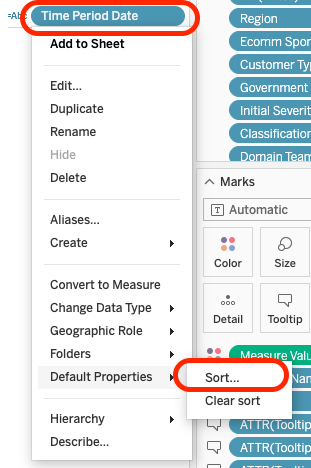
Sort by “Field” option is not available
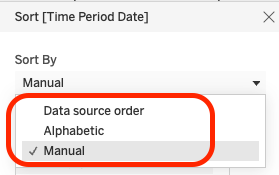
Ideally, it will be great if the below option is available from the Default Properties – Sort

Iron Viz
The ultimate live visualization competition judged on design, storytelling, and analysis
Iron Viz Competition Tableau Conference 2025
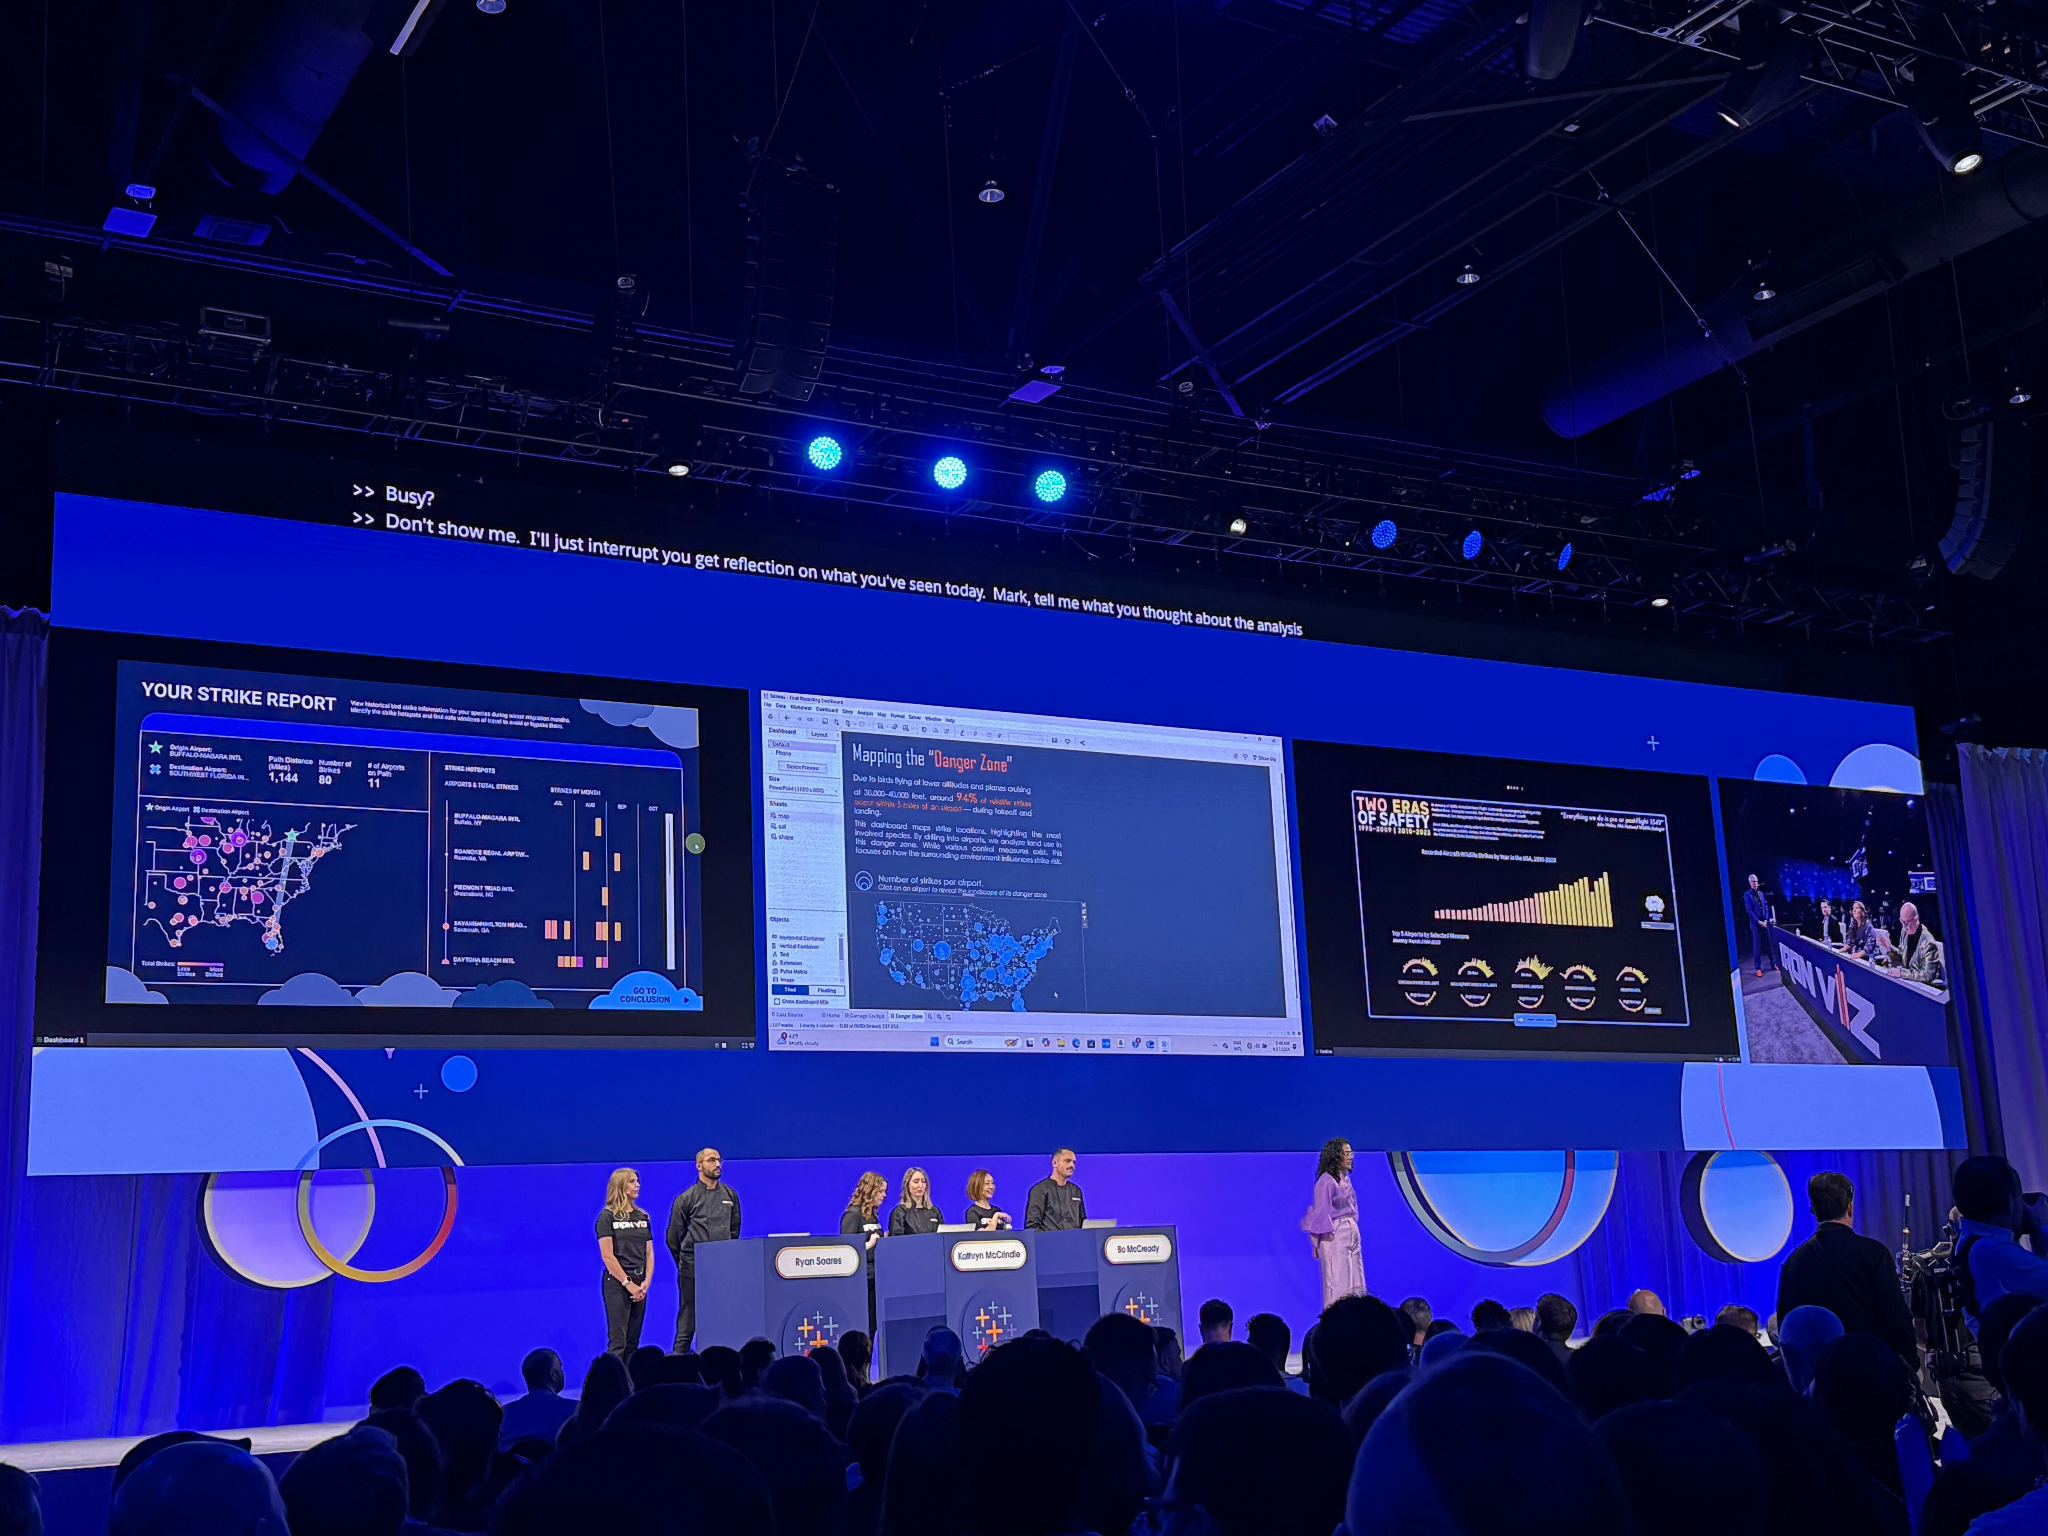

Iron Viz | Win or learn—you can’t lose
How are the Iron Viz Qualifiers judged?
The judging panel—which is made up of Tableau Ambassadors, Visionaries, and former Iron Viz finalists—reviews all submissions, doing the difficult task of selecting the finalists, using the following criteria to score all entries:
- Design: How appropriate is the design for the story being told?
- Storytelling: Is a clear story being told or a question being explored, and is there appropriate context?
- Analysis: How sophisticated and appropriate is the data that is being used for the story?
Data Night Out
Networking, fun, and celebrating data nerds

Sessions
The sessions were incredibly valuable. A few standouts I attended:
Conclusion
Tableau Conference 2025 showed that the platform is not just evolving—it’s transforming. With smarter automation, better scalability, deeper integration, and a renewed focus on user experience, Tableau is positioning itself as a truly modern analytics assistant. I’m excited to bring these learnings back to my work and continue exploring what’s next.
If you attended the conference too, I’d love to hear what stood out to you!
Share some pics from San Diego: