When data comes to my world

I achieved the Bachelor’s in Computer Science from Southern Polytechnic State University in 2012 and the Master’s in Engineering Management from University of Southern California in 2014. Like most new graduates, I did not know what my career would look like. However, I know I love data and how powerful the data is.

I am passionate about data. Everyone talks about data now, but do you know what data means to the business and how data can ultimately help the company make money? As a Business Intelligence Manager, my job is to make data accessible, present data visually, communicate data insights, and make recommendations to help business users make actionable decisions. Instead of providing pages of numbers, I use data to tell stories.

This website is the place to not only share my ideas of data analysis, visualization, insights and storytelling, but also share how I grow personally and professionally. I’d love to spread my positive energy to the world. Let’s start…

About

Nikki Yu – Manager, Business Intelligence

lovedataphone

DATA IS MY WORLD!

  • Highly skilled Business Intelligence Manager with nearly 10 years of experience in building and analyzing product, sales, operations, finance, and marketing dashboards and reports.
  • Demonstrated history of pulling large and complex data using SQL and building data pipelines.
  • Key figure in making recommendations on data metrics to improve work productivity.
  • Proficient in analyzing data insights and driving business results.

Data Visualization

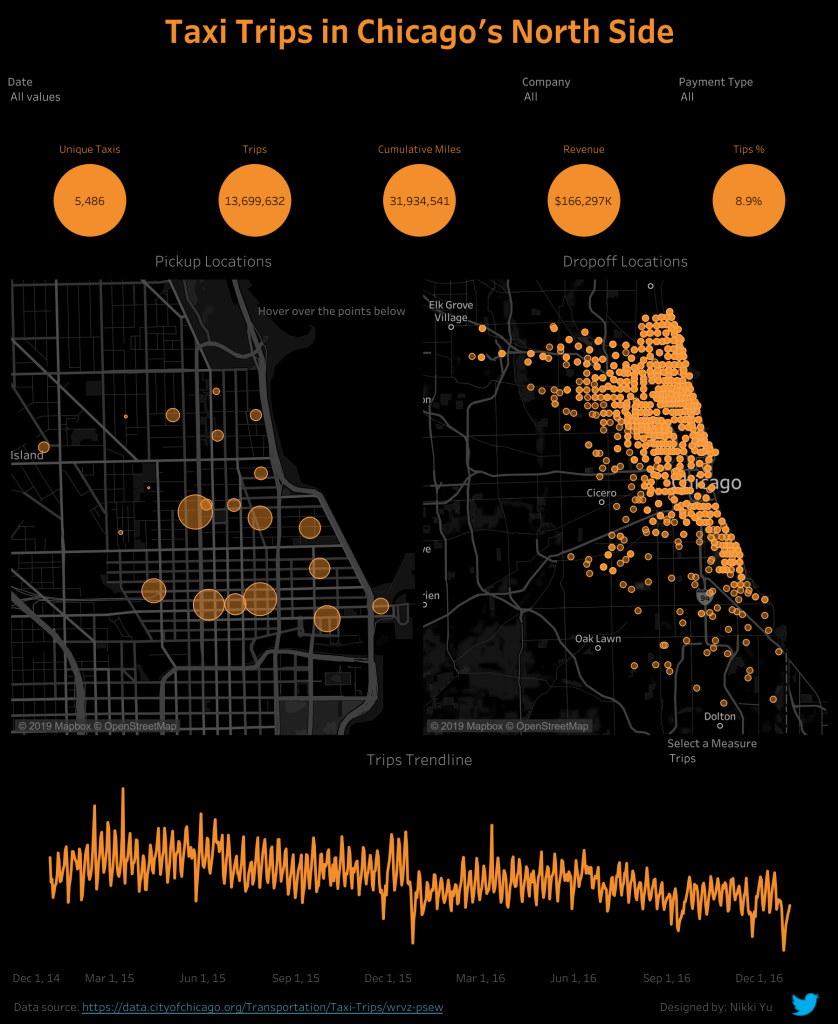
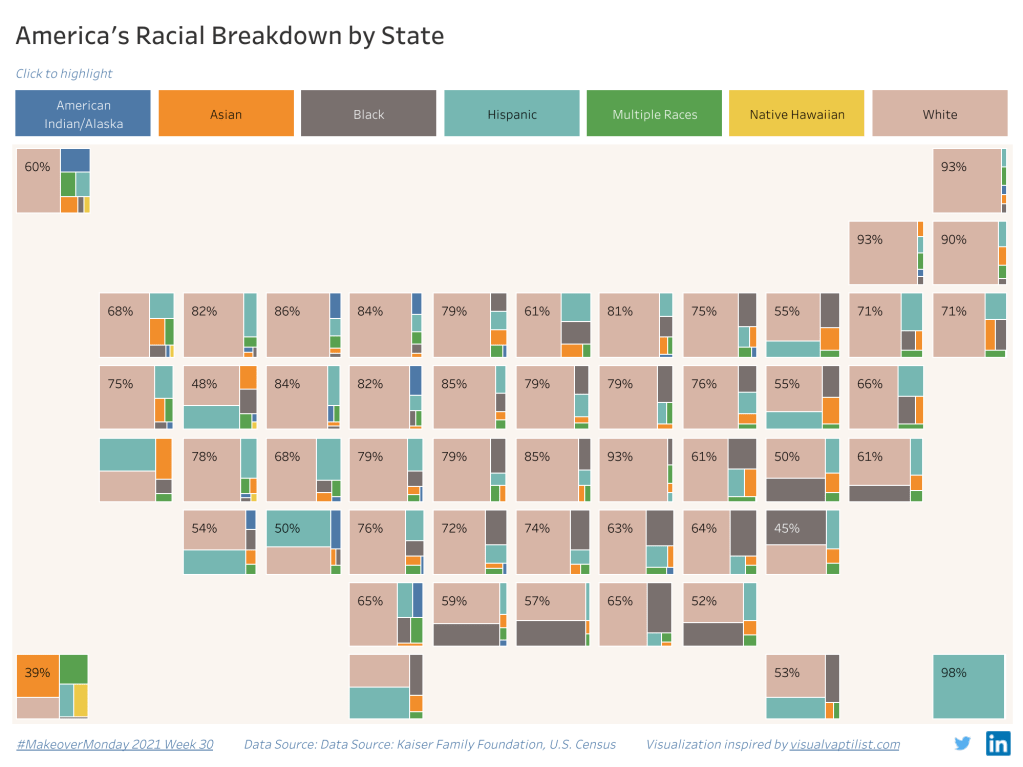
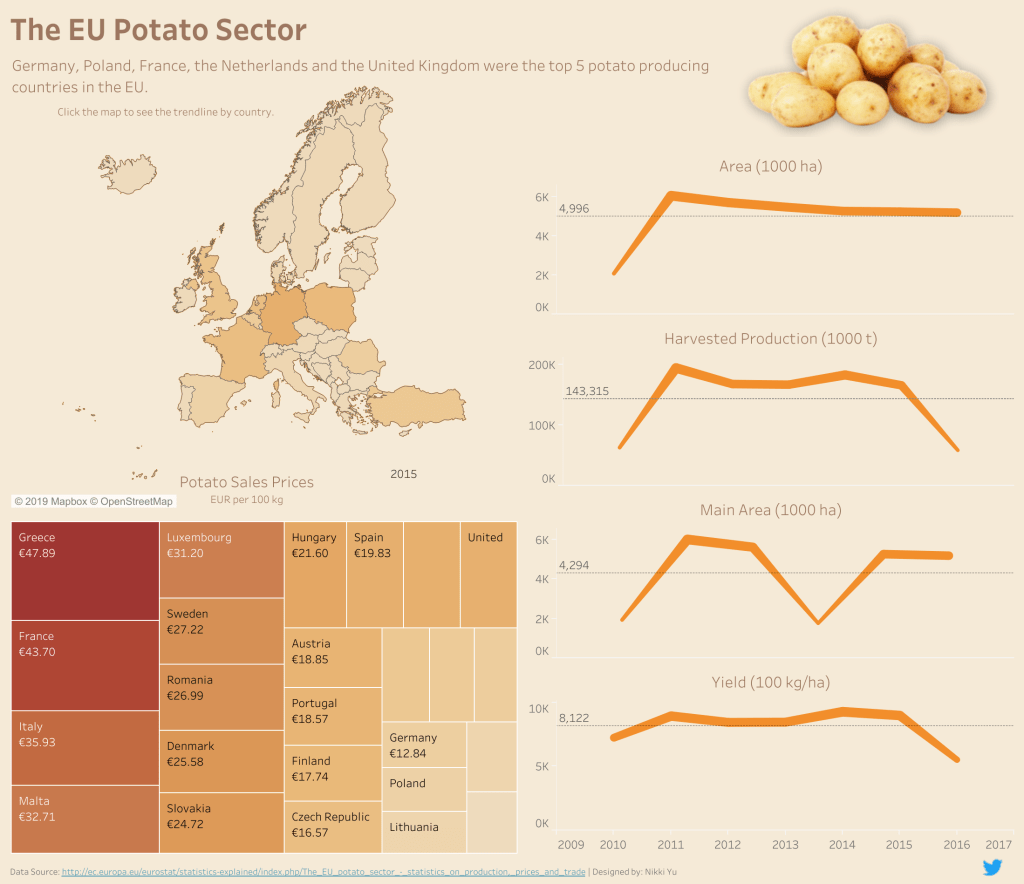
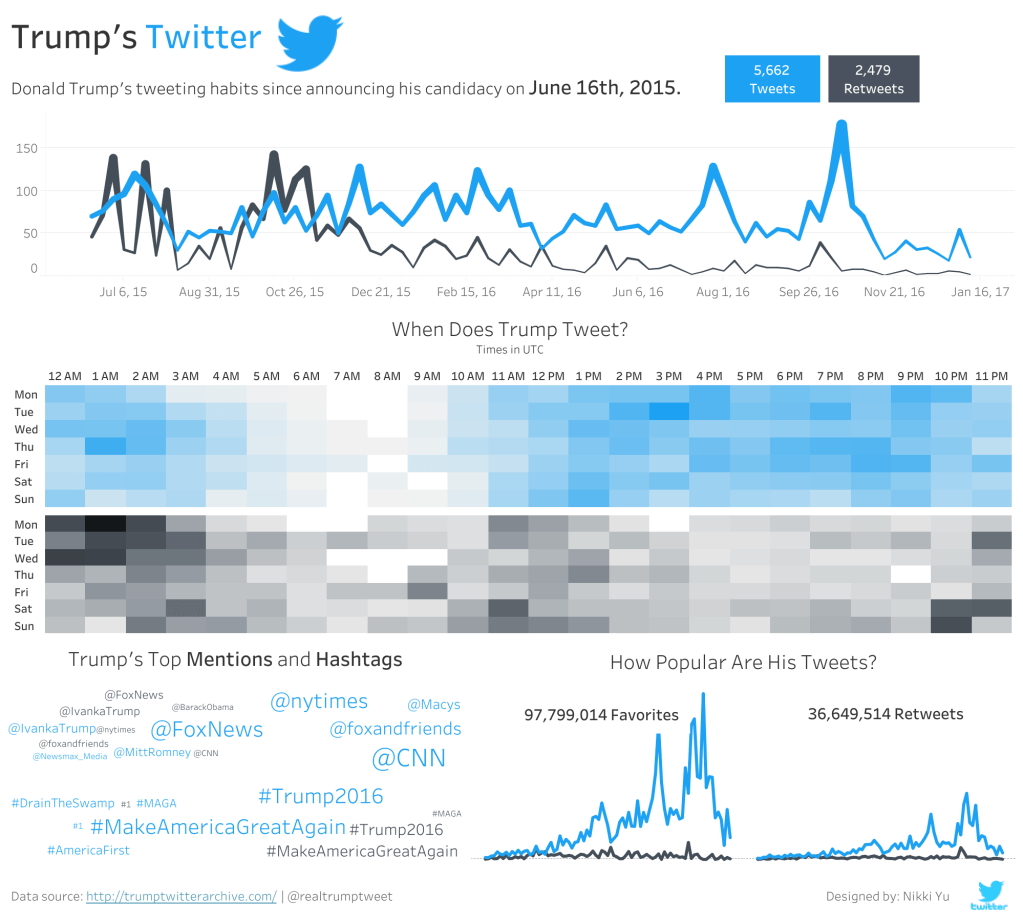
My portfolio showcases various Makeover Monday projects created in my free time. I love the Makeover Monday and Tableau community.

Makeover Monday is your weekly learning and development appointment with yourself and hundreds of passionate data people.

#makeovermonday

Interested in More Data Visualizations?

Please check my Tableau Public Profile: https://public.tableau.com/profile/nikki.yu


Let’s build something together.

Posts

What I Learned from Tableau Conference #Data23

Tableau Conference 2023 was held in Las Vegas from 5/9/23 – 5/11/23. I was so excited joining the conference this year after the pandemic. A lot of great features have been released or will be released soon. You may catch the highlights from Tableau Conference 2023 on Salesforce+.

How to String Agg a Dimension in Tableau?

Tableau does not have string_agg() function like SQL. I’d like to show list instead of asterisk when multiple values are present. Use Case: my company works with vendors to manufacture products. One product might be manufactured by different vendors . I’d like to show vendors associated with each product. If there are multiple vendors associated …

Predictive Analytics – Project 5: A/B Test a New Menu Launch

Topic: A/B Test | Tool: Alteryx Project Overview: The coffee restaurant would like to conduct a market test with a new menu and needs to figure whether the new menu can drive enough sales to offset the cost of marketing the new menu. To minimize the risk, the management team decides to test the changes …