
Tableau Conference 2023 was held in Las Vegas from 5/9/23 – 5/11/23. I was so excited joining the conference this year after the pandemic. You may also catch the highlights from Tableau Conference 2023 on Salesforce+.
The first keynote was in the morning 5/9/23. A lot of great features have been released or will be released soon.

Tableau GPT
Salesforce Introduces Tableau Pulse (Tableau GPT): Generative AI for Analytics. Tableau GPT, Tableau Pulse, VizQL Data Service, and Data Cloud for Tableau will be available later 2023. How exciting!
Tableau GPT is being built on Salesforce Einstein GPT.
The demo was very interesting, which showed that we can ask questions and share the data/viz via email, cell phone, Slack, Tableau server, etc.
Tableau GPT will also be available in Tableau Prep. A great example is to ask GPT to write regex to parse the data from a Json field. It will make my life easier because I no longer need to remember the syntax or check the syntax every time when I write a complex regex function.
Session I joined: 2:00PM-2:40PM 5/10/23 Tableau GPT: Innovate for the Future with Generative AI presented by Jeff Chen and Nathan Nichols.
My opinion: Even though we can ask the questions to AI, we have to understand what the question is, why we ask the question and if the results from AI makes sense. We need to understand basics and shouldn’t automatically trust AI. We need to be more questioning and validating. Also, AI should deliver data insights instead of just the query results.
Tableau Embedded Analytics
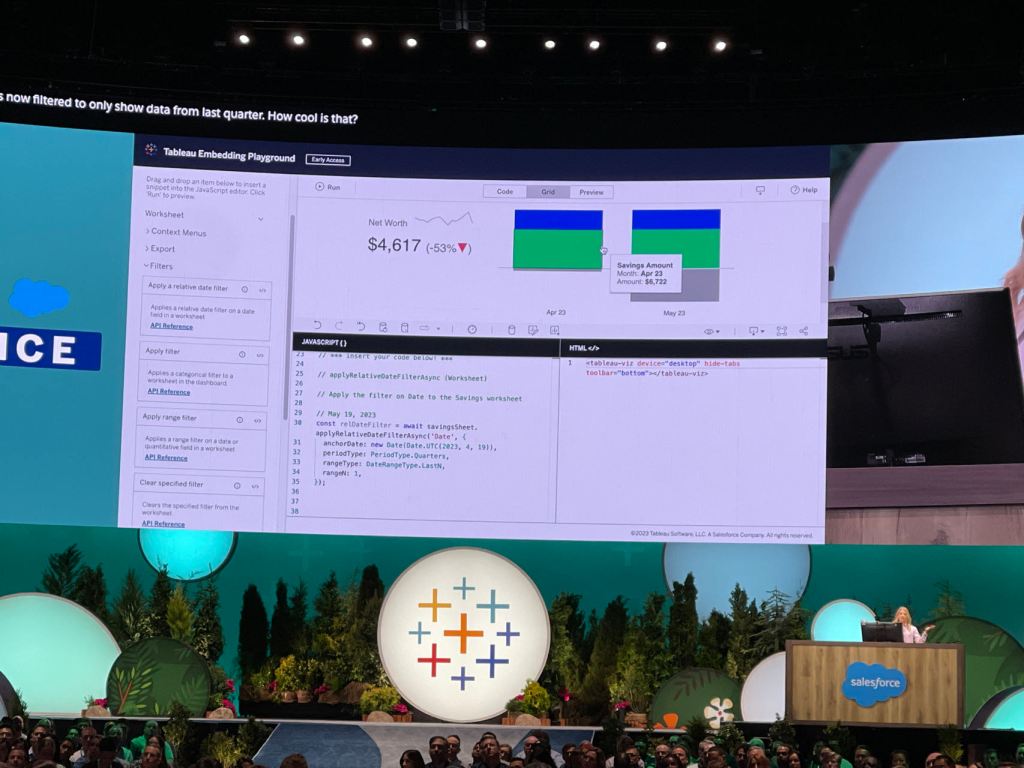
Tableau Embedded Analytics embed and customize Tableau’s interactive, analytical capabilities to create a seamless experience with your products.
Here is the Tableau Embedding Playground:
What are available right now:
- Quickstart embedding Tableau with Embedding Playground
- Seamless authentication with Connected Apps
- Interactive embedded visualizations using Embedding API
- Embedded analytical exploration using web authoring
- Personalized experience with User Attribute Functions
- Automation with REST APIs using the Postman Collection
What’s coming in 2023:
- Embedding Playground GA
- Spport for partitioned coockies
- Permission management without provisioning users in Tableau
- More support for embedded white labeling
- Native Tableau LWC component with seamless authentication
Session I joined: 5/10/23 10:30AM – 11:10AM Build Unique Data Products with Tableau Embedded Analytics presented by Ewald Hofman and Ashiwin Sekar.
In this 40 mins session, Ashwin Sekar walked us through how to use the APIs and developer tools to quickly and easily embed the full power of Tableau analytics into Cumulus Bank platform.
It looks like Tableau Embedding Playground is very user friendly. It can generate the codes of the visualizations automatically through drag and drop.
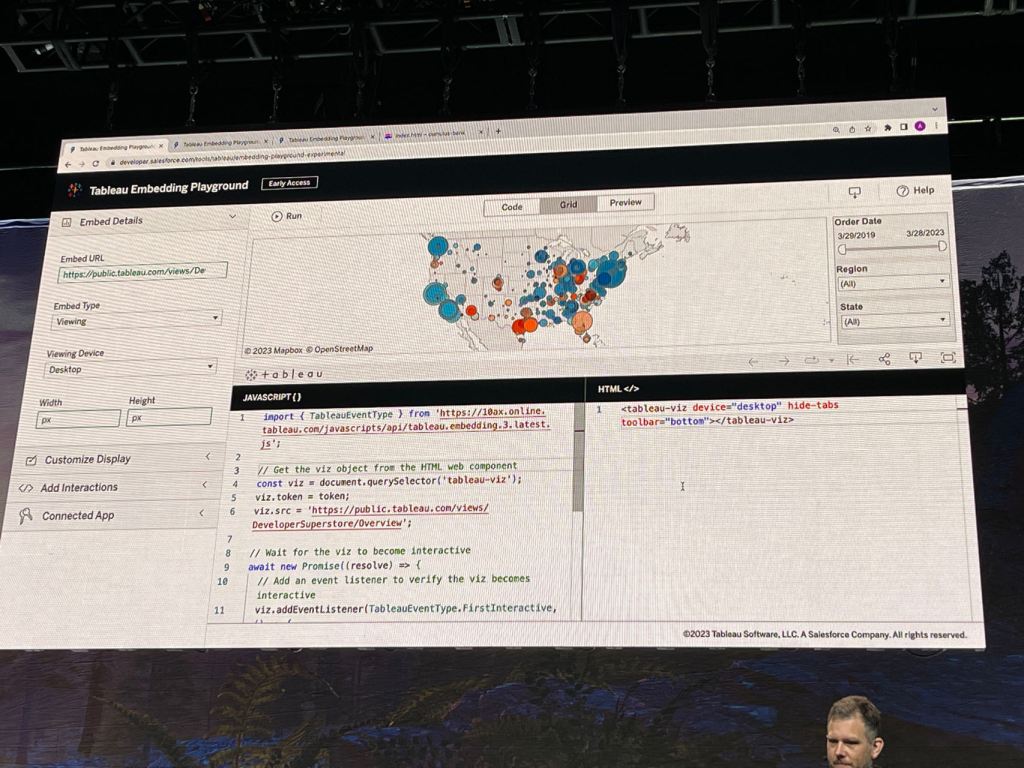
When the codes are ready, copy the codes and paste them to Glitch for example to create web applications for the client. In 40 minutes, Ashwin created a dashboard on Cumulus Bank’s platform to show account overview, bank branch locations, monthly/quarterly spend, etc. I was very impressed.
Tableau Cloud
Tableau Cloud is the new Tableau Online. It performs better on computation, storage, network, and content migration.
Session I joined: 10:30AM – 11:10AM 5/11/23 Kickstart Your Tableau Journey on Cloud presented by Prashant Keshri Keshri and Prashant Sharma.
Prashant presented how to kickstart the Tableau journey on Cloud Abstract: what cloud data infrastructure should look like, how to optimize the analytics deployment on the cloud, and using Tableau to find and share new insights with everyone in the organization.
Tableau Catalog
Session I joined: 5/11/23 12:00PM – 12:40PM Build Trust with Tableau Catalog presented by Blair Hutchinson and Sterling Winter.
Blair Hutchinson and Sterling Winter presented how Tableau Catalog’s capabilities can be used to build trust in data and improve governance. They showcased best practices for surfacing valuable metadata in the flow of analysis.
I didn’t use Tableau Catalog before, so I explored the Tableau documentations to understand more details:
More Features:
- Tableau will include more data connectors, such as Amazon S3.
- It will be easier to add images. GIFs will be available.
- Sankey chart is available. My friend Alex already tested the new chart type and wrote this blog: Multi-Level Sankey with the New Sankey Chart Type in Tableau.
- Tableau Prep will be more powerful:
- Set a row as the header easily.
- Smart recommendation: remove duplicates in one click.
- Spatial joins.
- Tableau GTP will be available in Tableau Prep.
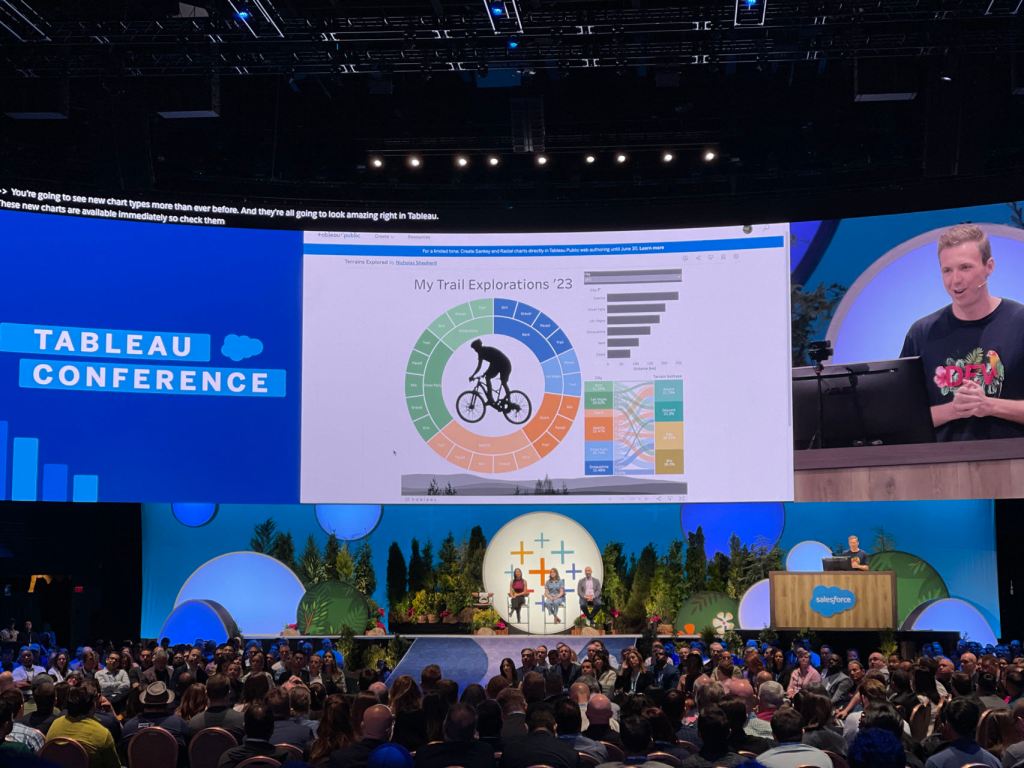
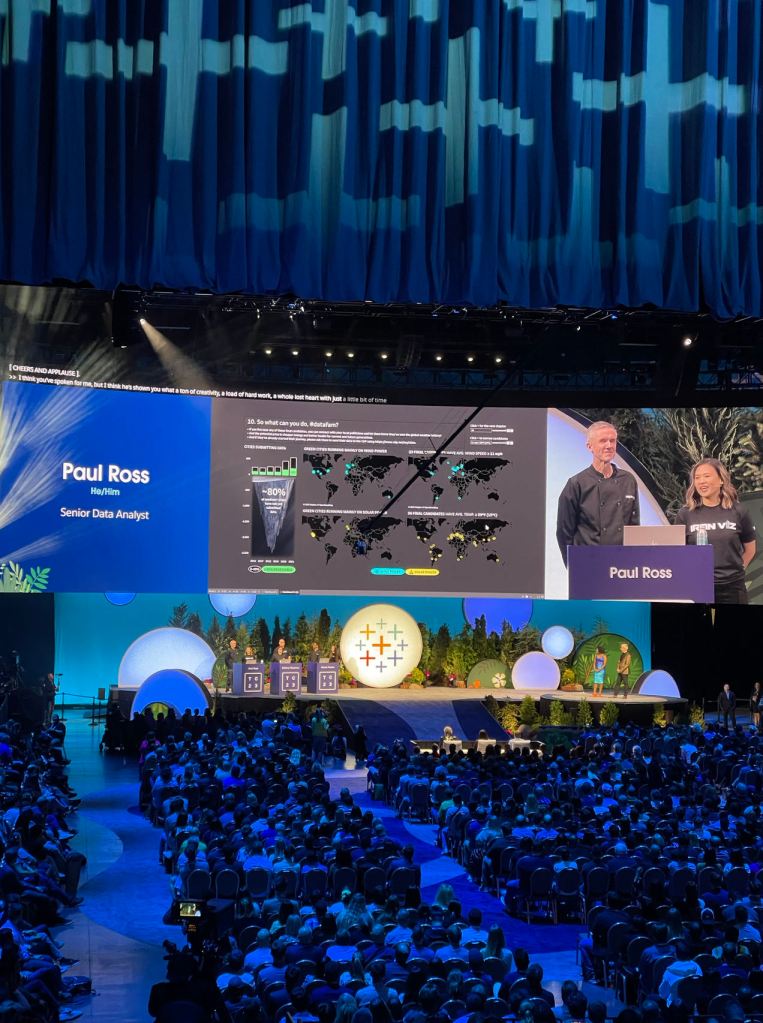
Iron Viz
Iron Viz was my favorite during the conference. My favorite quote from Iron Viz: “Win or learn, you cannot lose.” As a Tableau user and a big fan of data visualizations, I should keep learning and practicing to get better on it.
I was inspired by the data visualizations built by the three finalists in 20 nail-biting minutes. The judging criteria include: design (beautiful), analysis (insightful) and storytelling (thoughtful), which should also be used to evaluate our dashboards created for the business stakeholders.
Raul Ross won this year!!! I love his dashboard.
Also, I joined a session relevant to Iron Viz: 1:00PM – 1:40PM 5/11/23 Behind the Curtain: Iron Viz presented by Timothy Vermeiren.
Iron Viz has produced some of the best vizzes from the Tableau community. This session dive into the most memorable Iron Viz Visualizations over the years and celebrate this year’s top 15 game-inspired entries. I took the pictures below during the seesion:

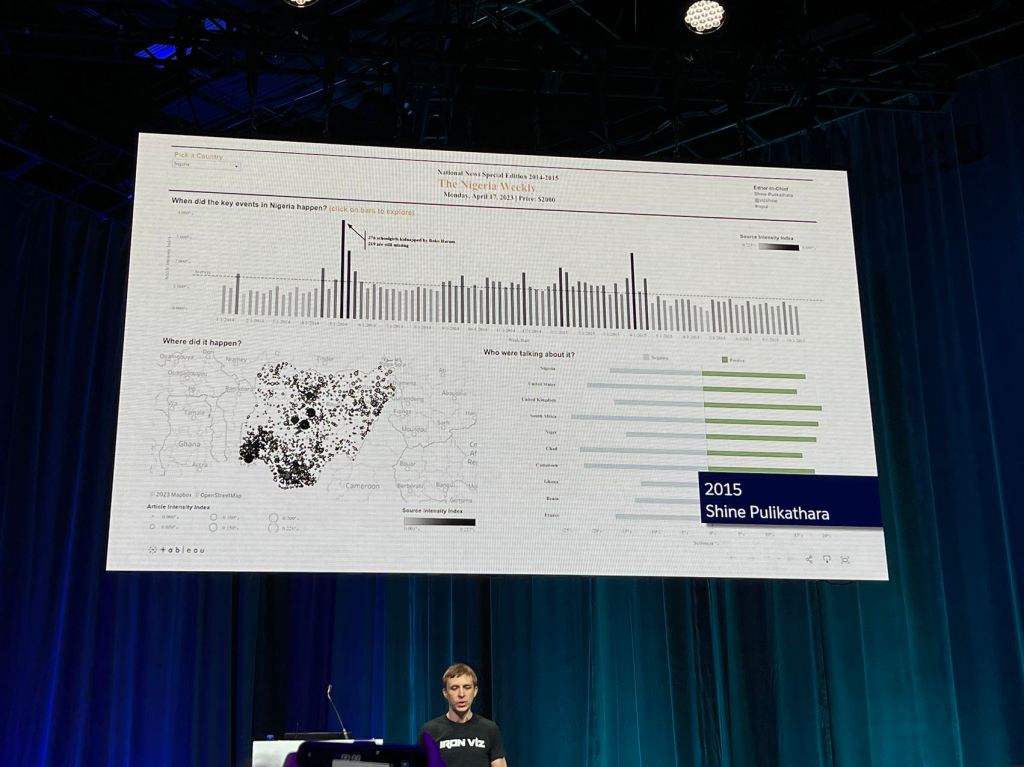


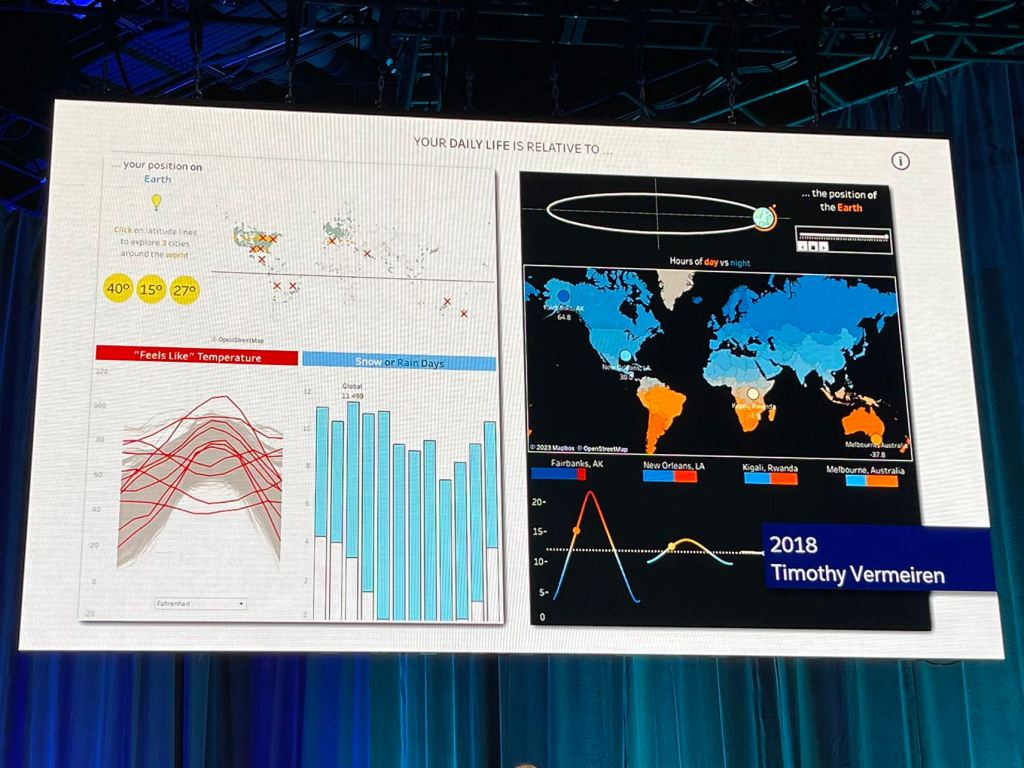

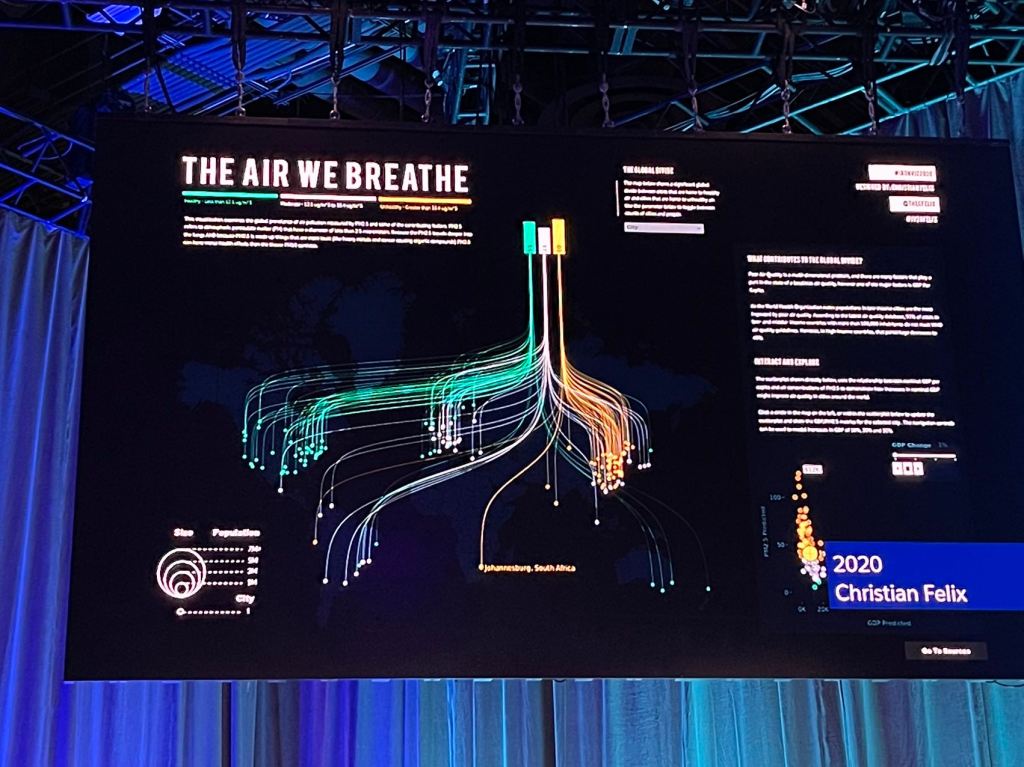
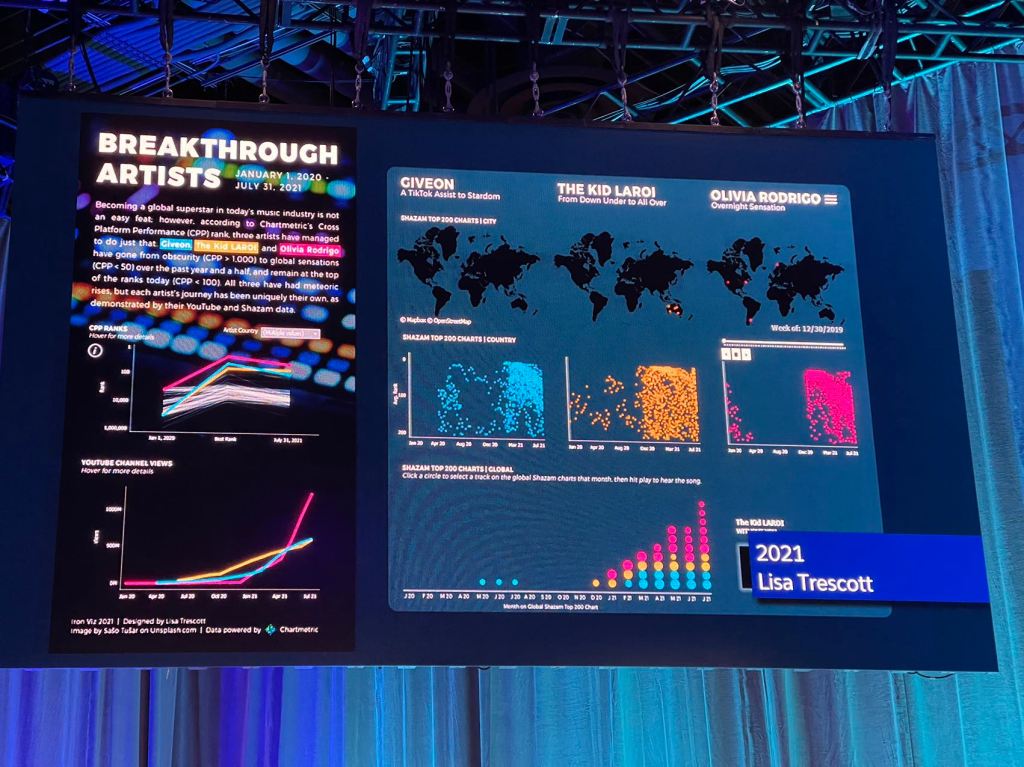
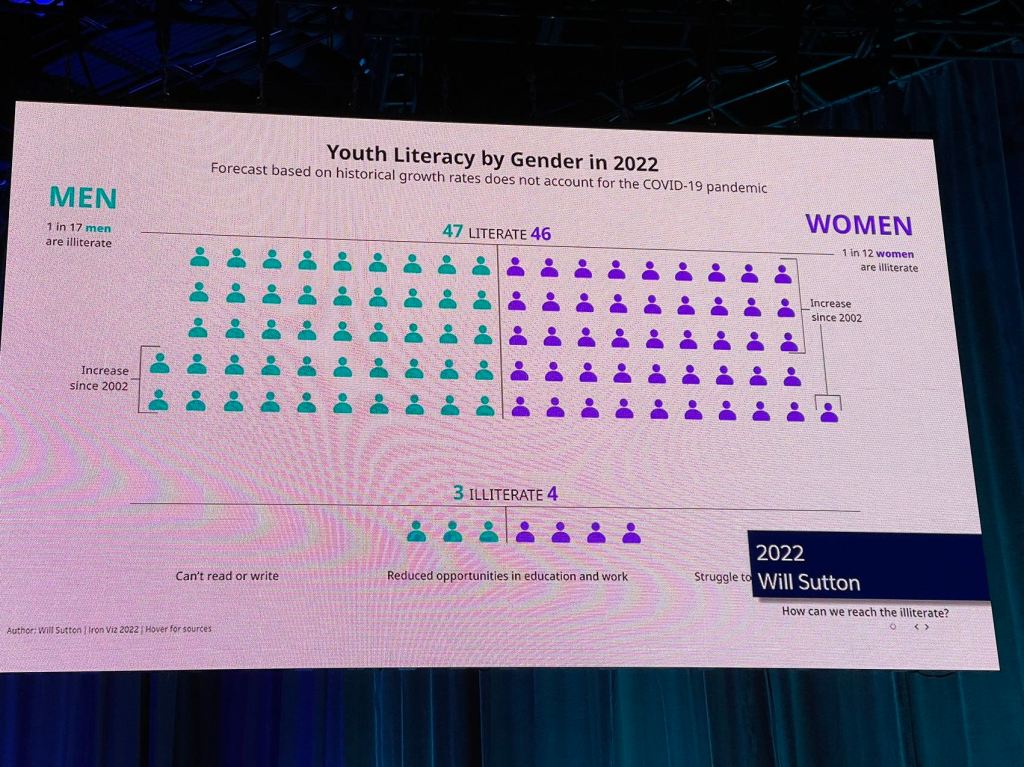
Tableau Tips
The following tips can be used to improve the dashboard performance:
Session: Vroom Vroom! Performance Tuning. presented by Yuri Goto
- Data Type matters:
- Boolean is faster than Integer; integer is faster than string.
- Logical Calculations, try using Boolean.
- Bad
- IF Date = Today() THEN ‘Today’ ELSE “Not Today” END
- Good
- Date = Today()
- Bad
- Minimize the use of COUNTD
- Use ELSEIF, instead of ELSE IF for the faster performance
- Use Tableau native features over Calculations
- Groups, Sets, Bins
- Custom date fields
- Combined fields, Aliases
- Use IN statement, instead of OR
- Sub-Category = ‘Tables’ OR Sub-Category = ‘Chairs’
- Better: Sub-Category IN (‘Tables’, ‘Chairs’)
- LOD vs Tableau Calculation
- Where are the calculations being processed
- LOD is at datasource side
- Table Calculation is at Tableau side
- Where are the calculations being processed
Below I include the other two great sessions that I found very useful for dashboard designs:
Session: 12:00PM – 12:40PM 5/10/23 How to Take Your Tables to the Next Level presented by Autumn Battani and Luke Stranke. I love this presentation!!! Thank you both for the great advice.
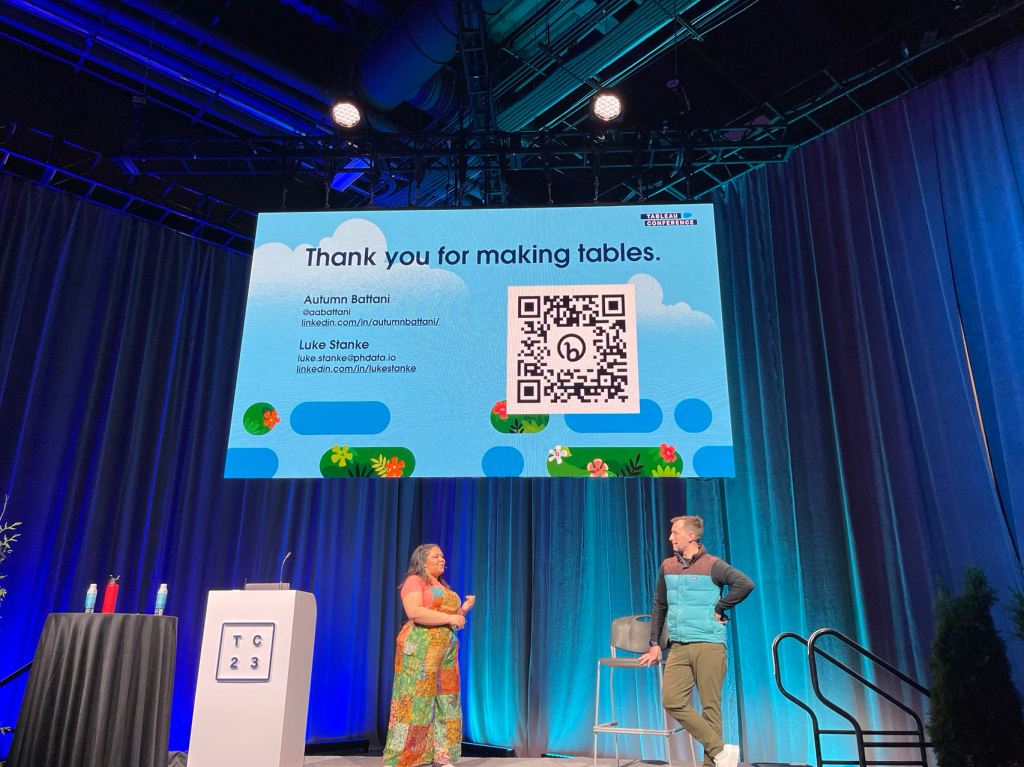
All of the tips are in Autumn’s blog: Tables Aren’t Boring, You Are.
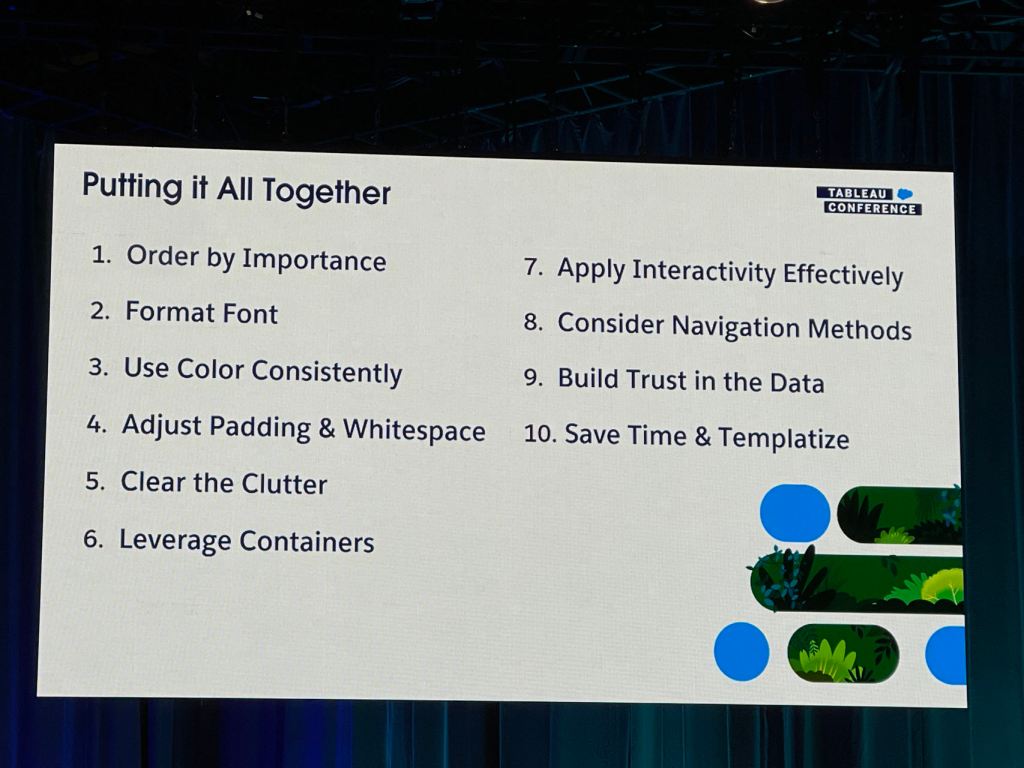
Session: 2:00PM – 2:40PM 5/11/23 10 Steps to User-Friendly Design presented by Eric Balash and Cait Sojka
We can download the checklist from Lovelytics website: 10 Steps to User-Friendly Design.
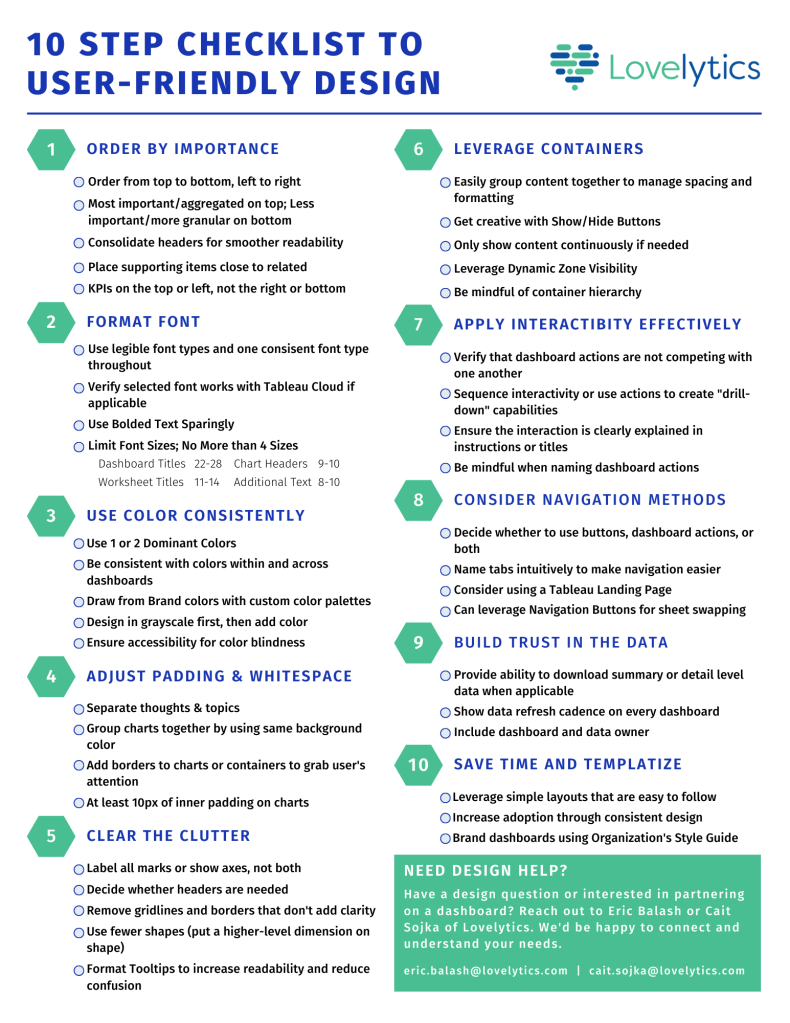
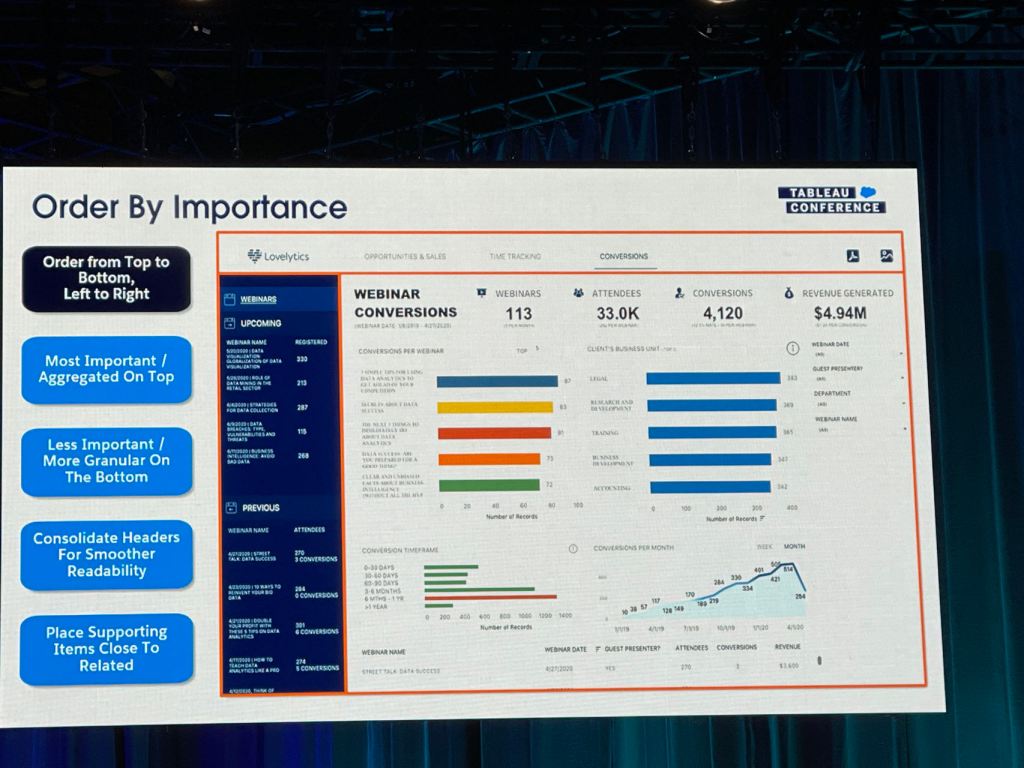
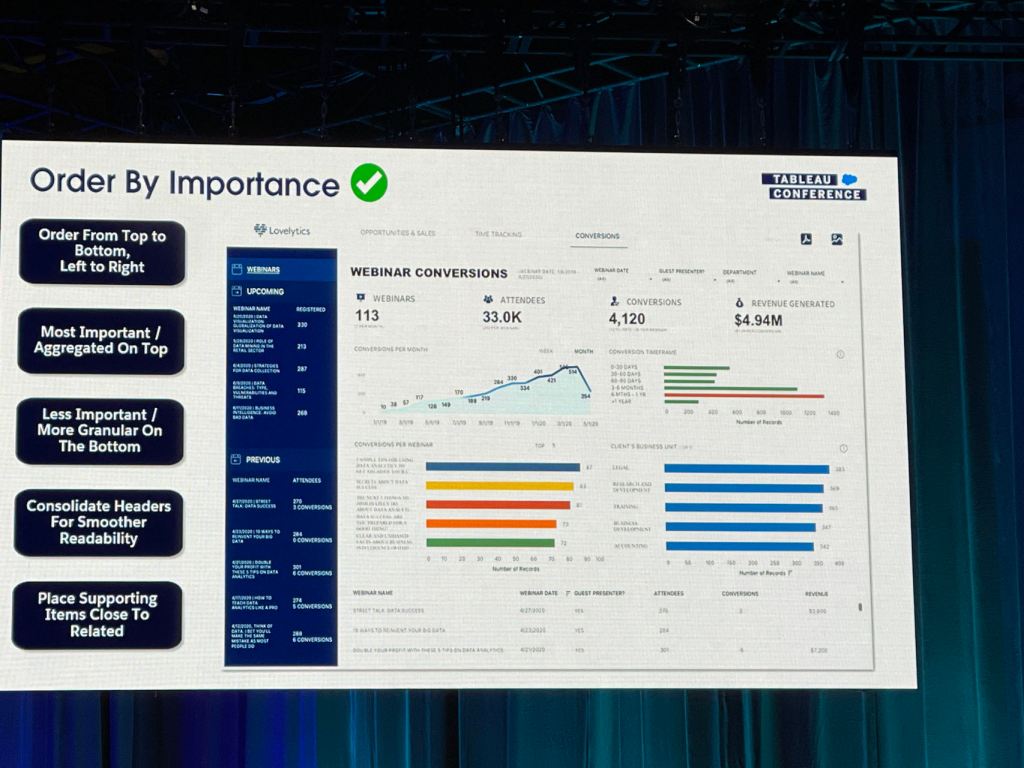
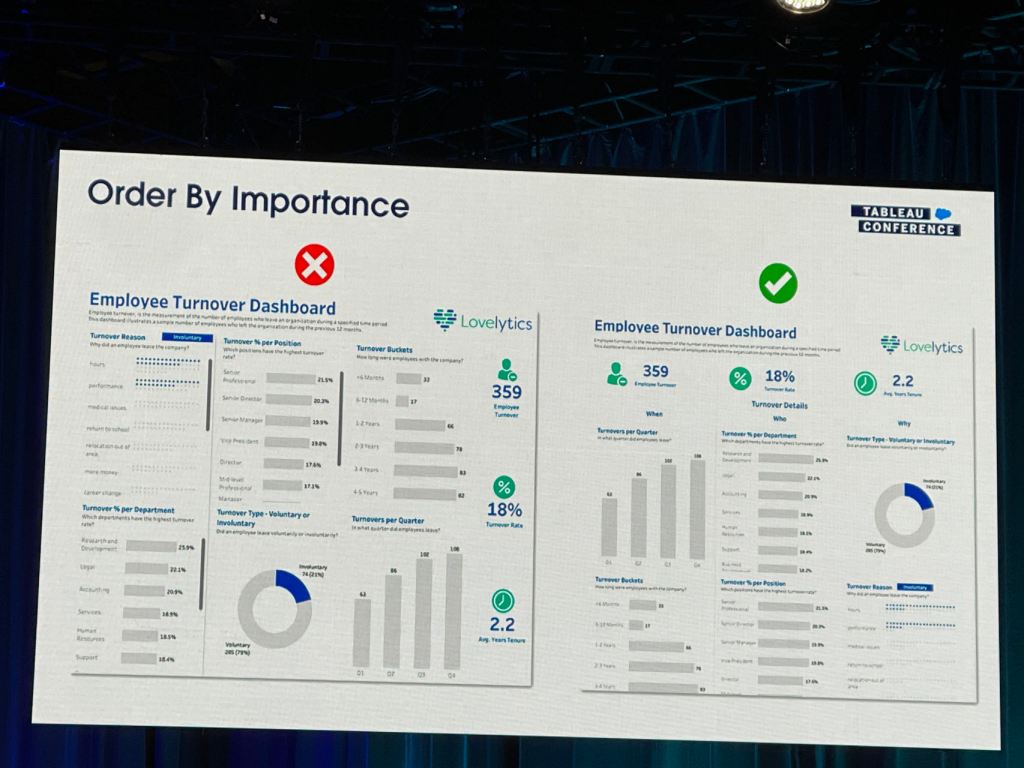
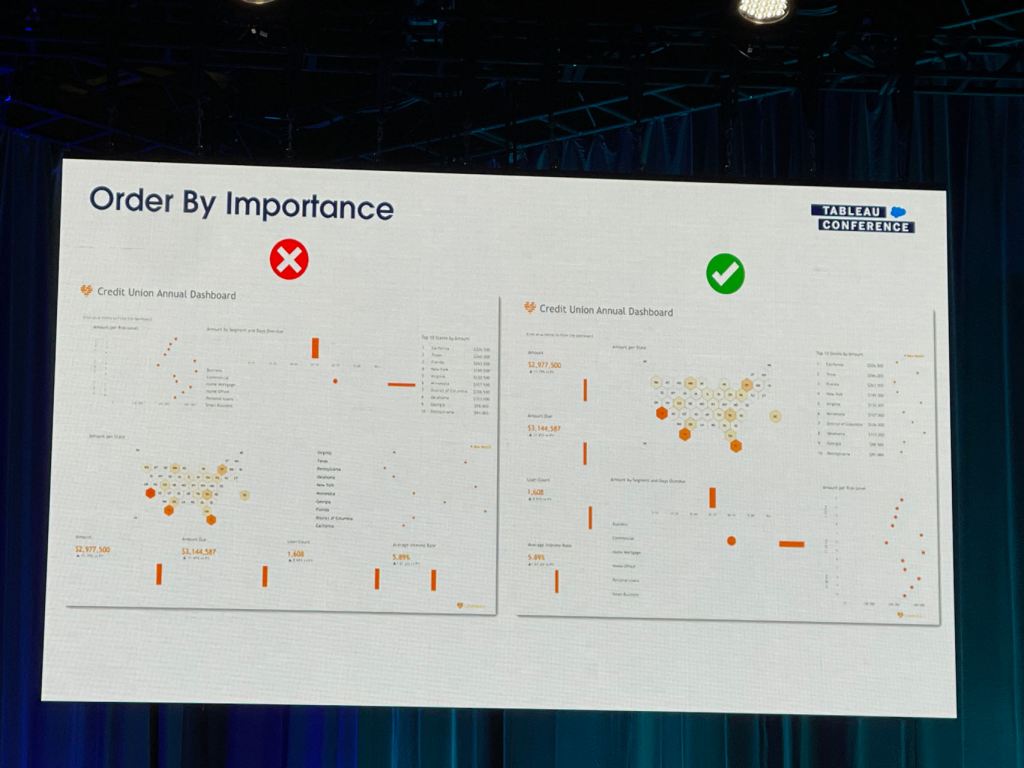
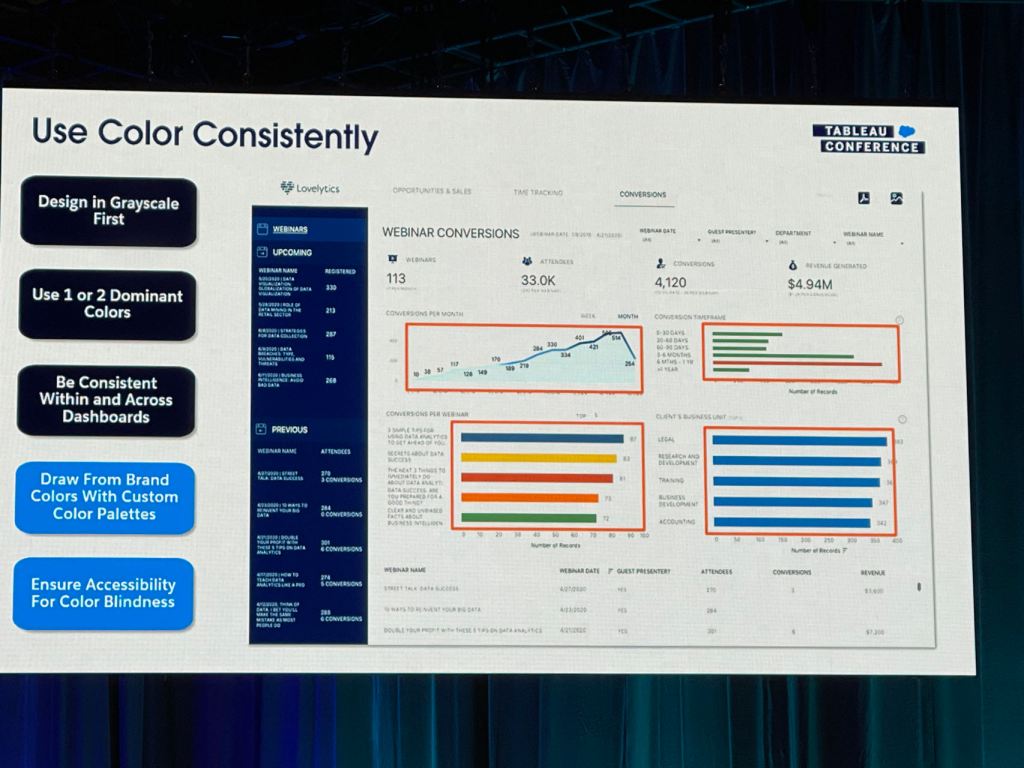
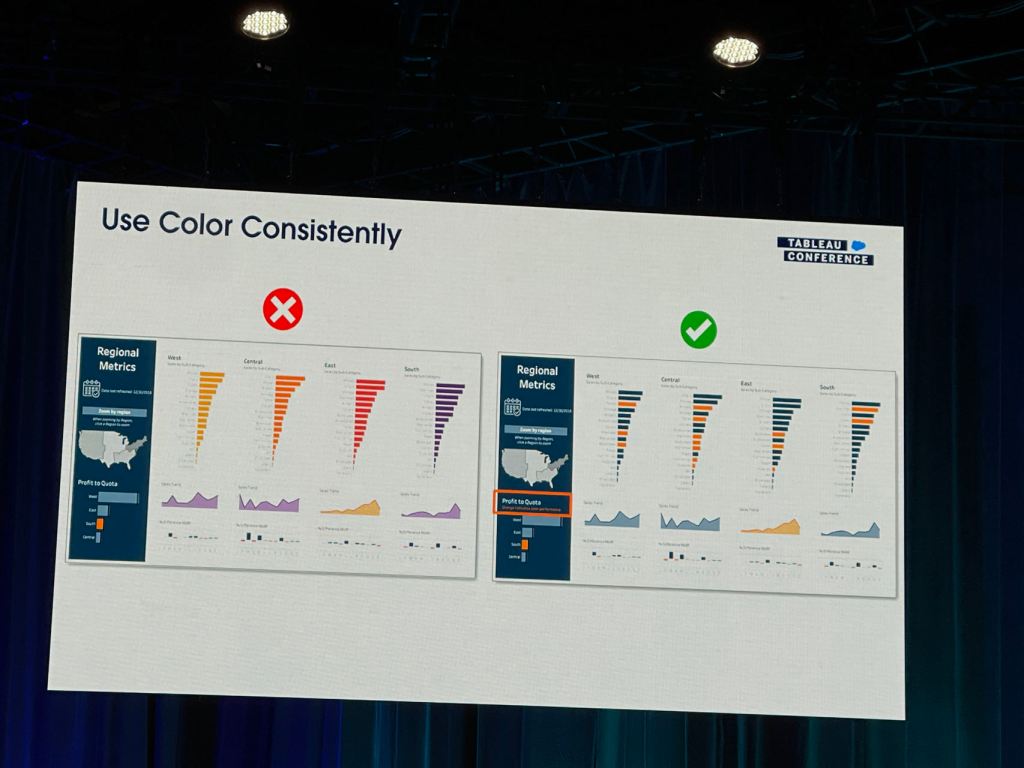
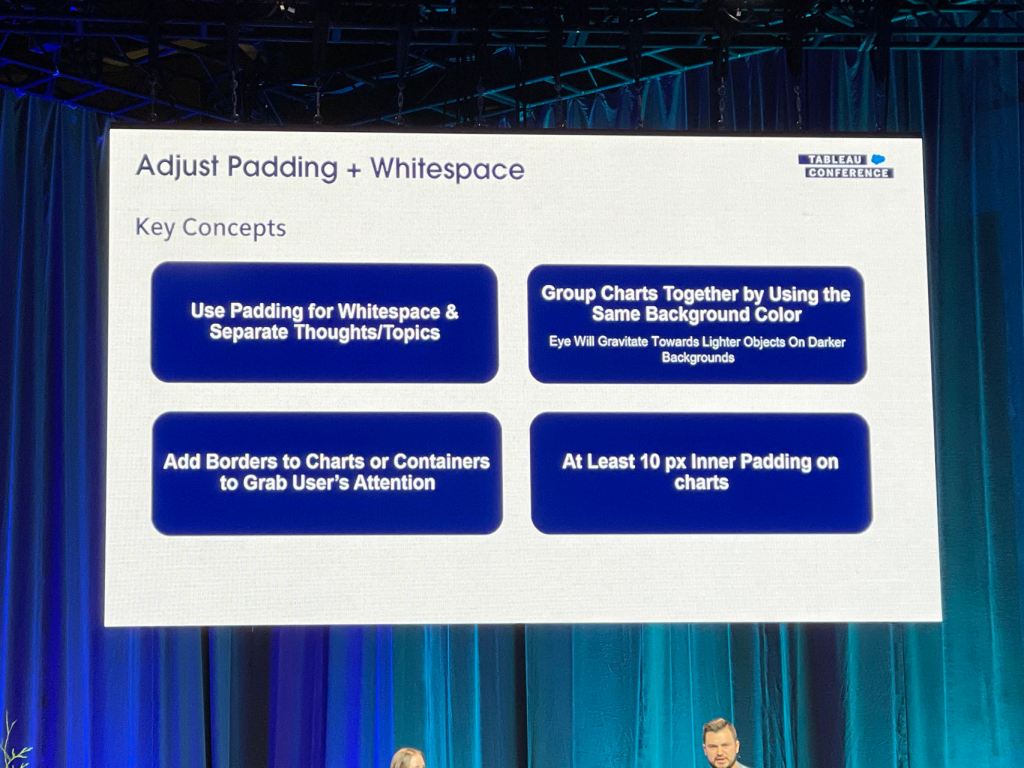
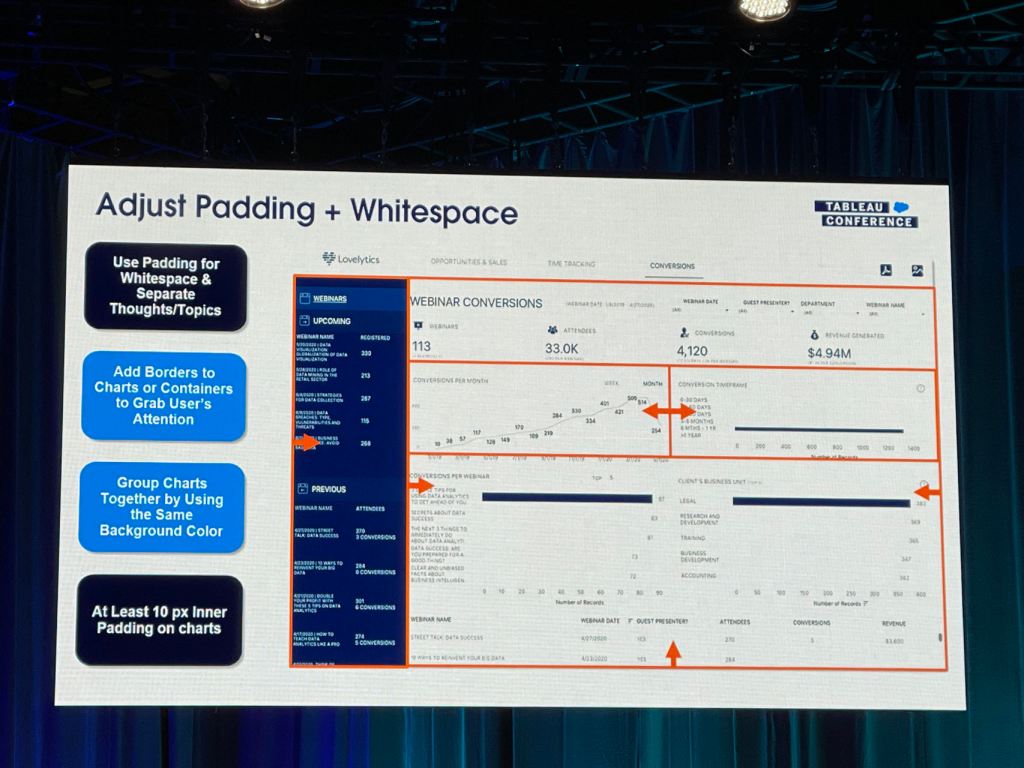
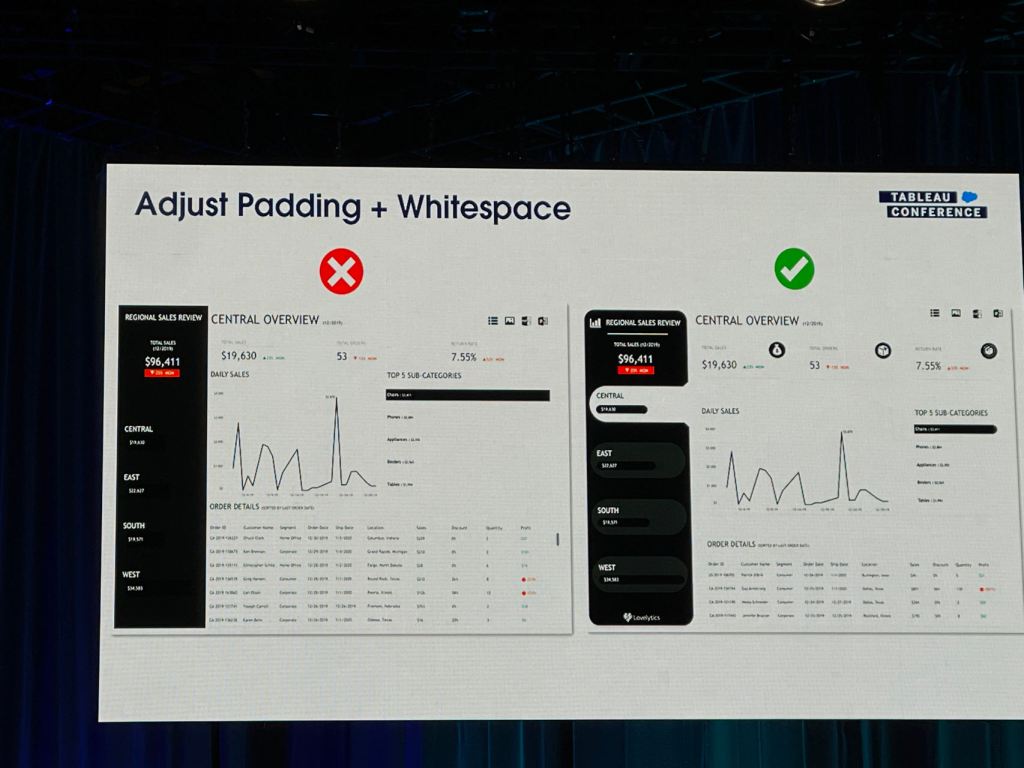
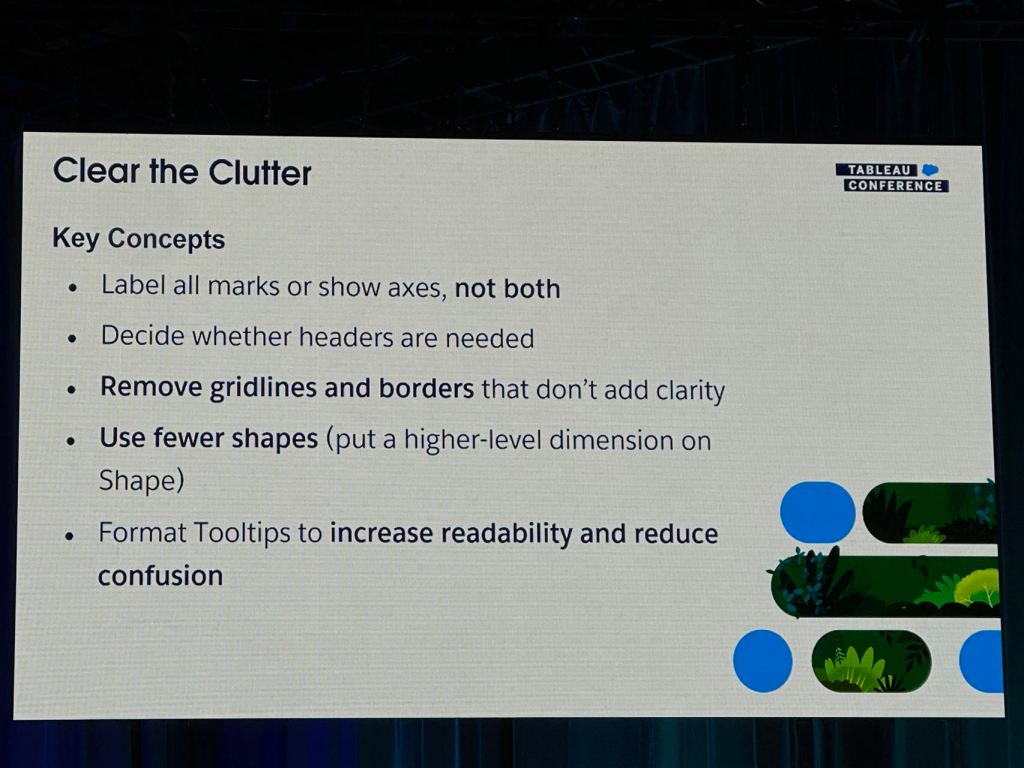
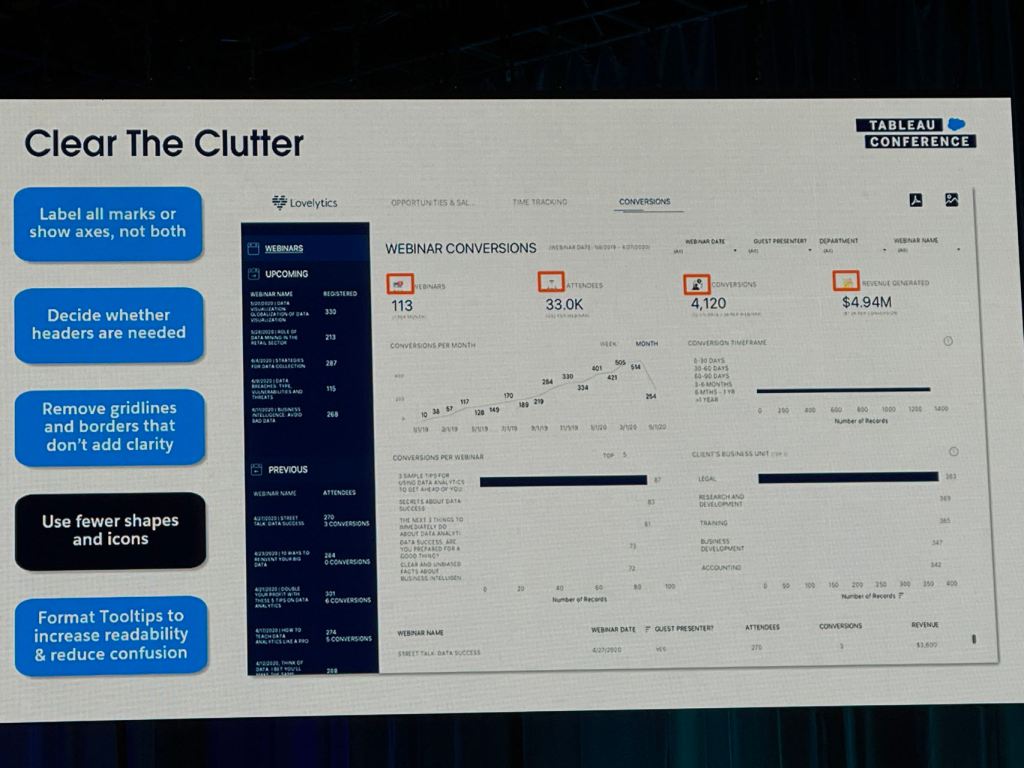
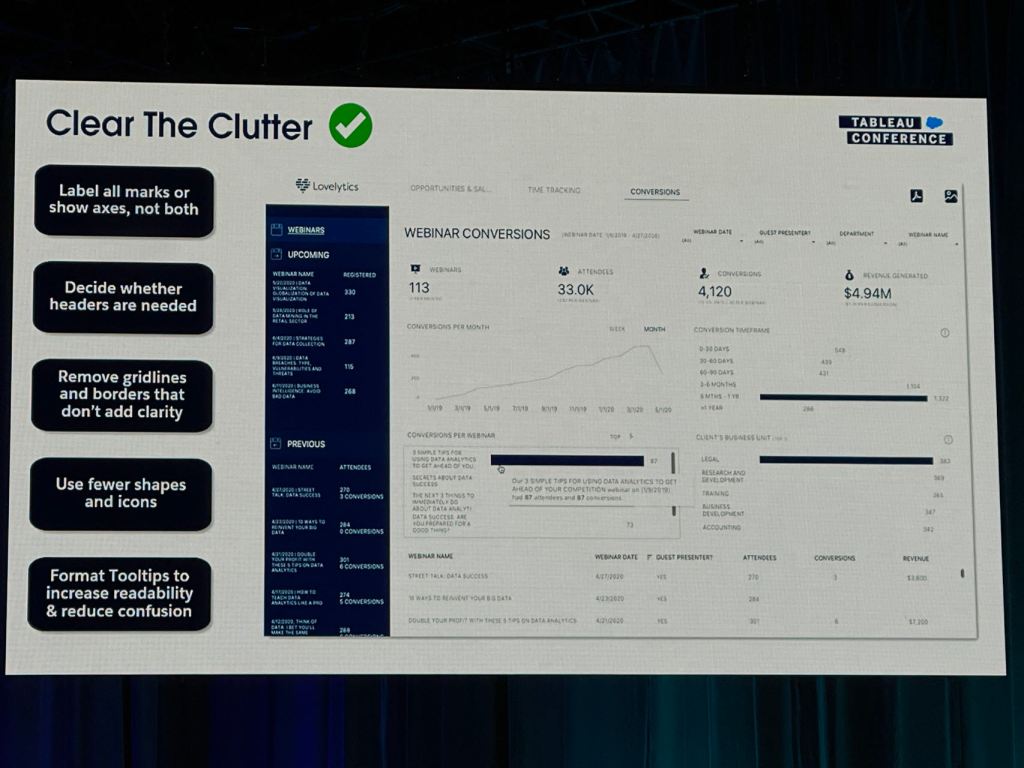
I also took some notes from the session that Eric and Cait showed how they improve a Tableau dashboard for their client using the checklist above.
I’m not sure if it is appropriate to include these pictures below taken from the conference in my blog. I just feel it is useful for me and many others. I can delete them if Eric and Cait don’t authorize.
1. Order By Importance
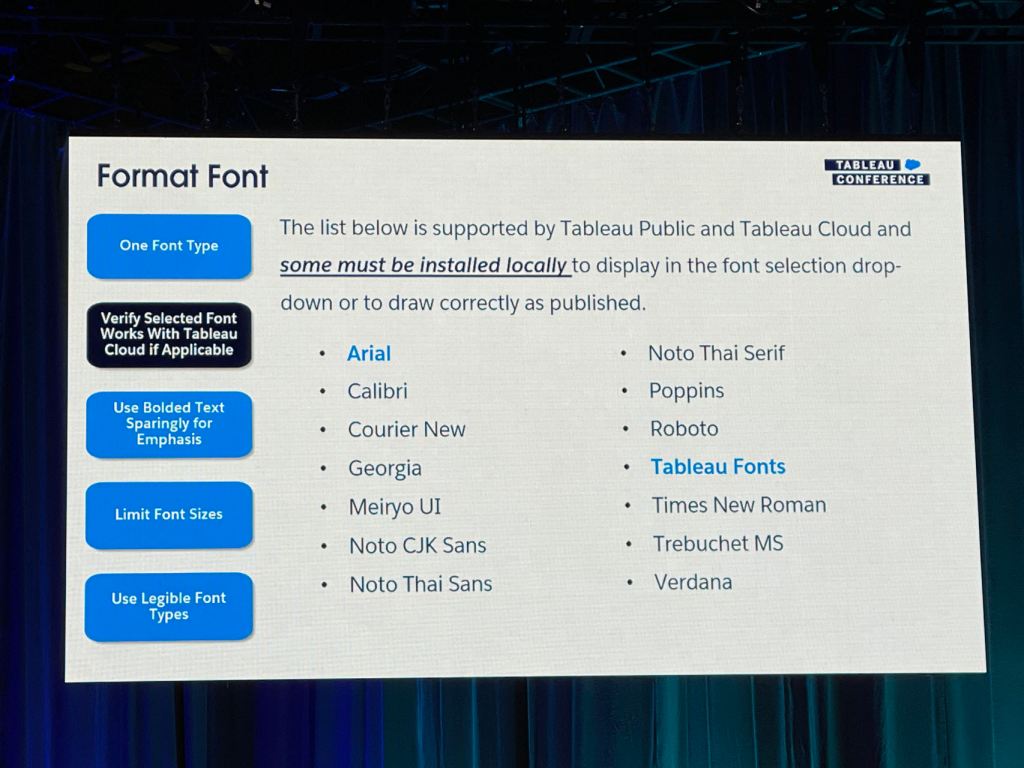
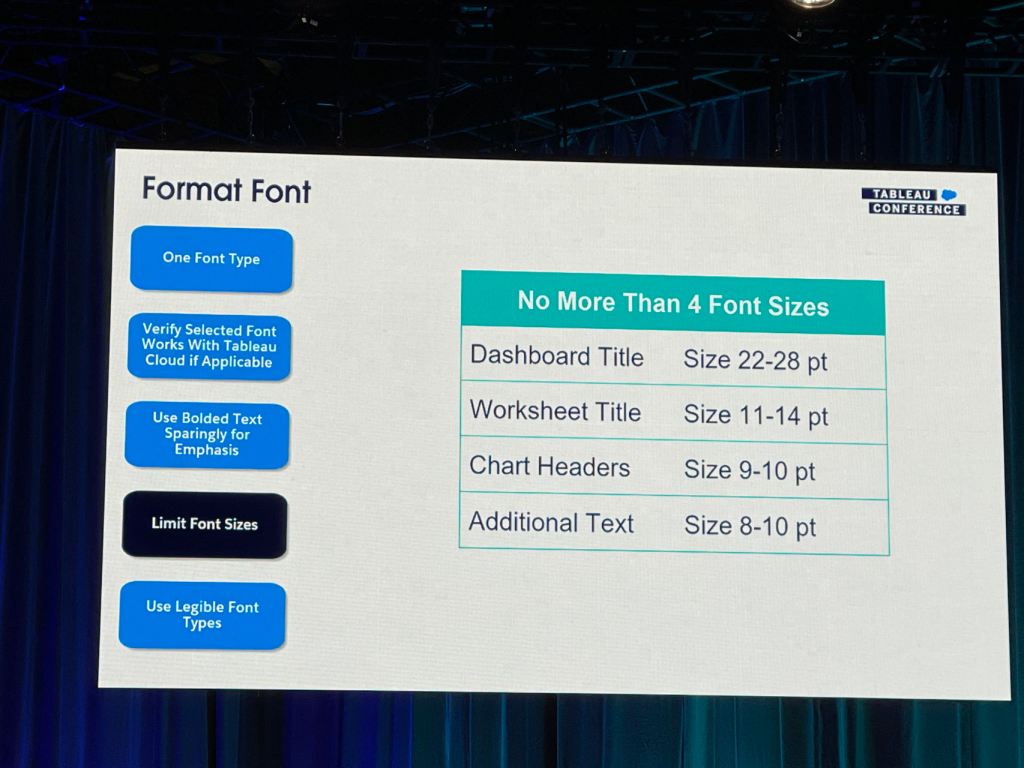
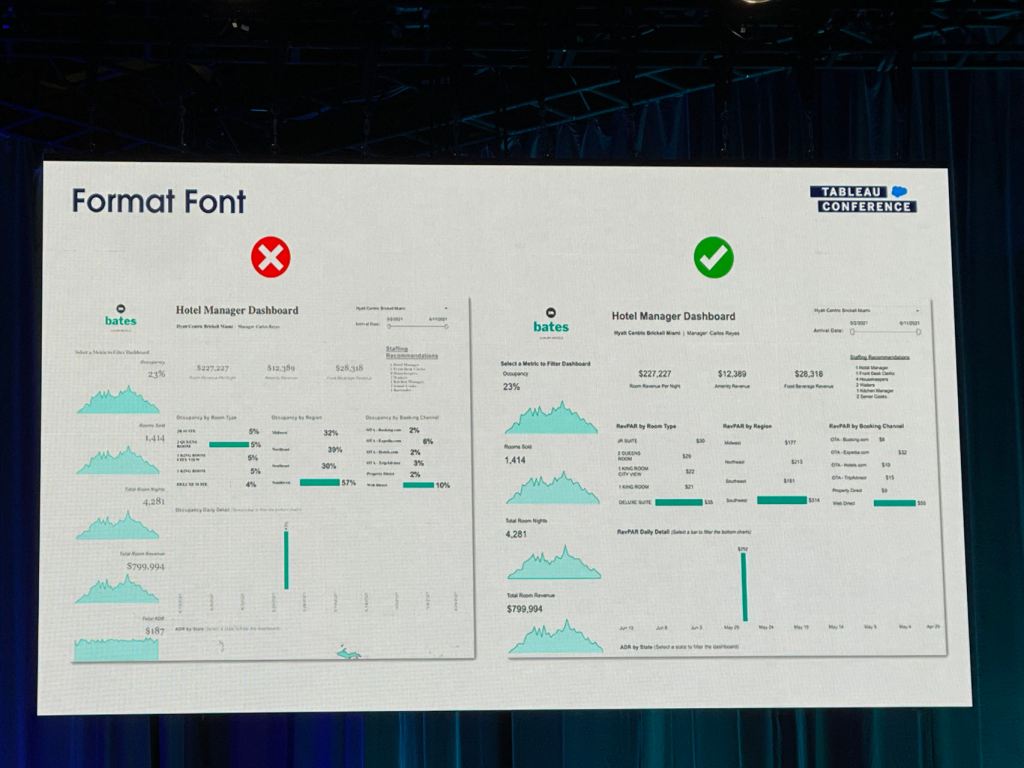
2. Format Font
3. Use Color Consistently
4. Adjusting Padding + Whitespace
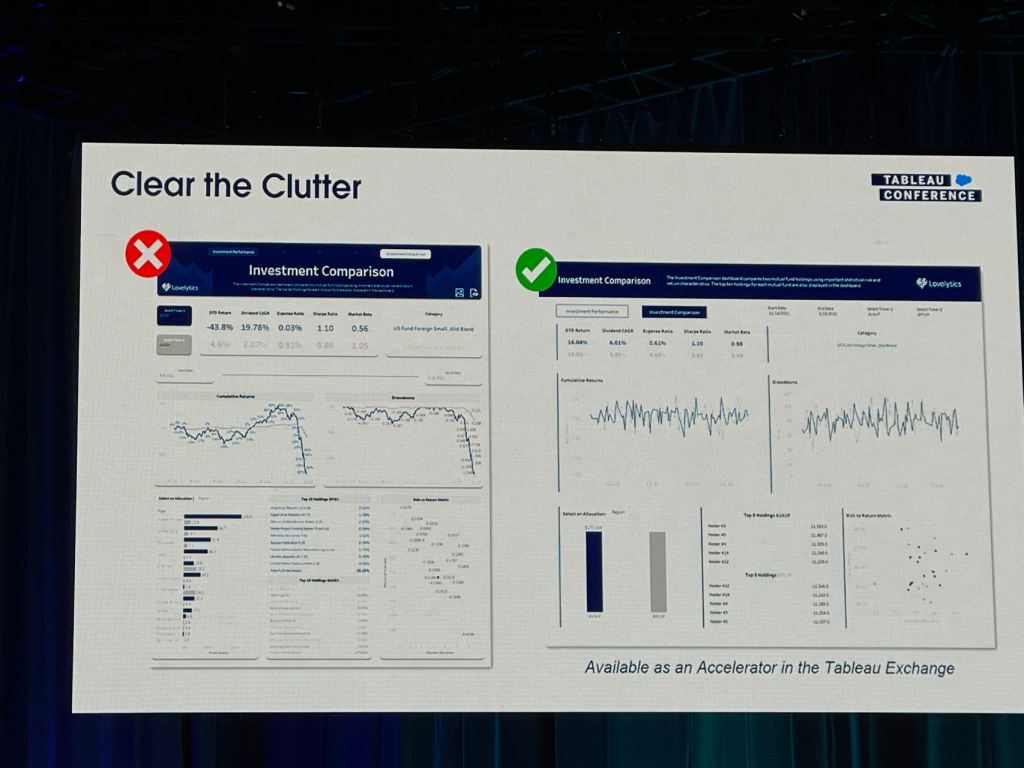
5. Clear The Clutter
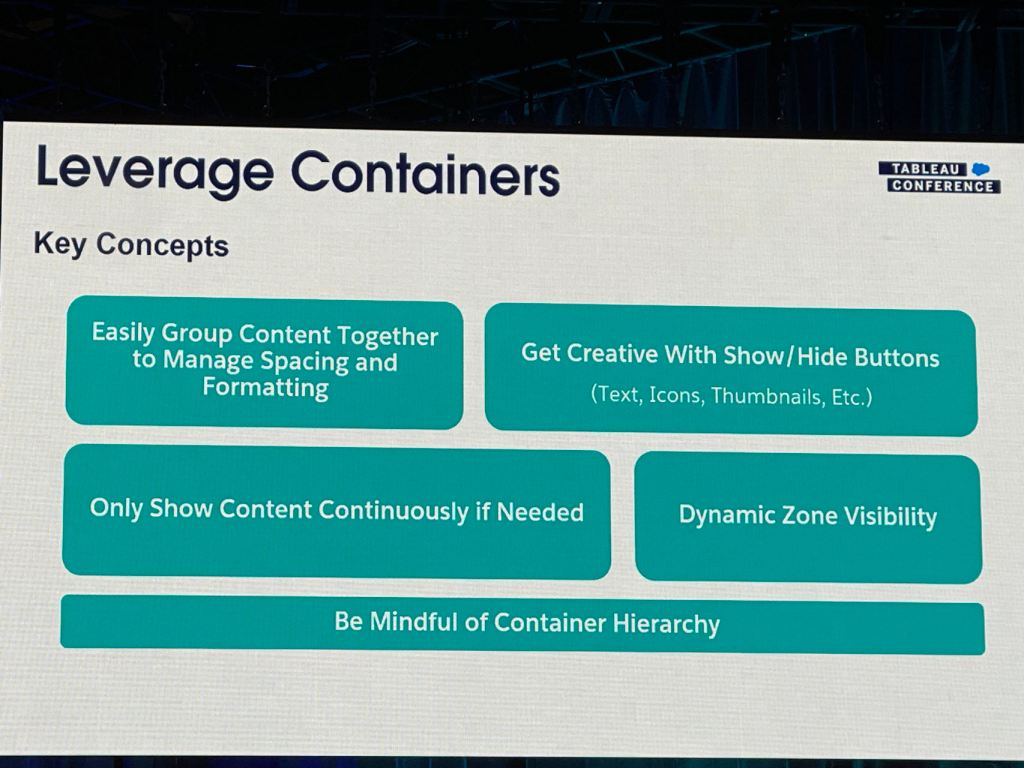
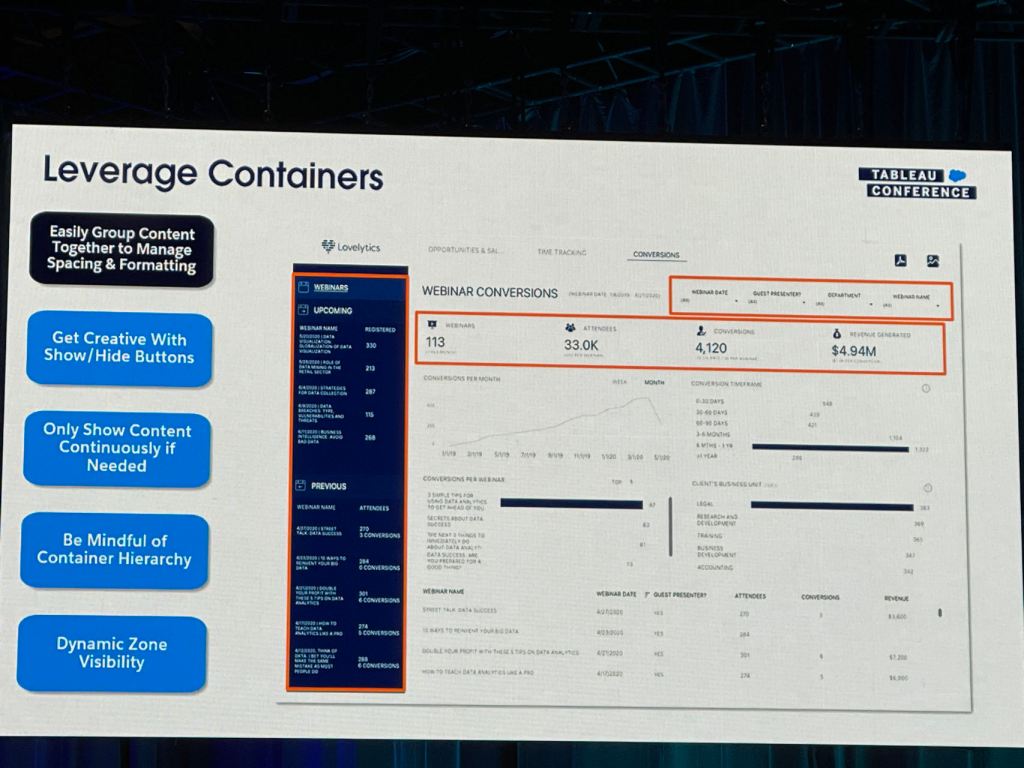
6. Leverage Containers
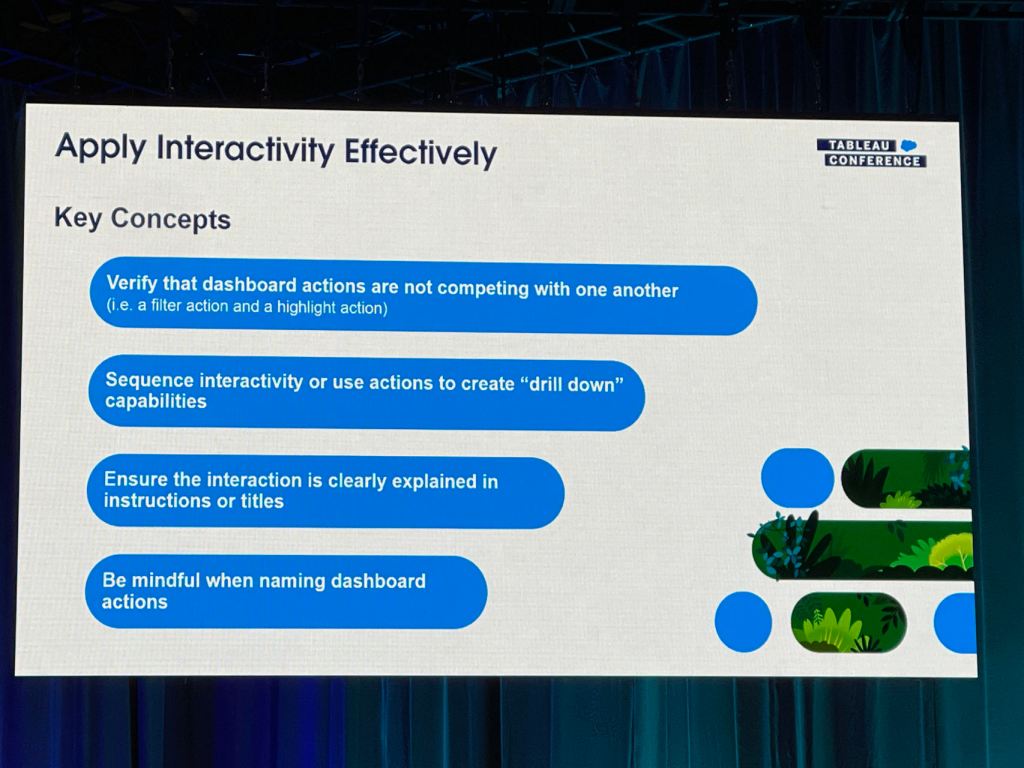
7. Apply Interactivity Effectively
8. Consider Navigation Methods
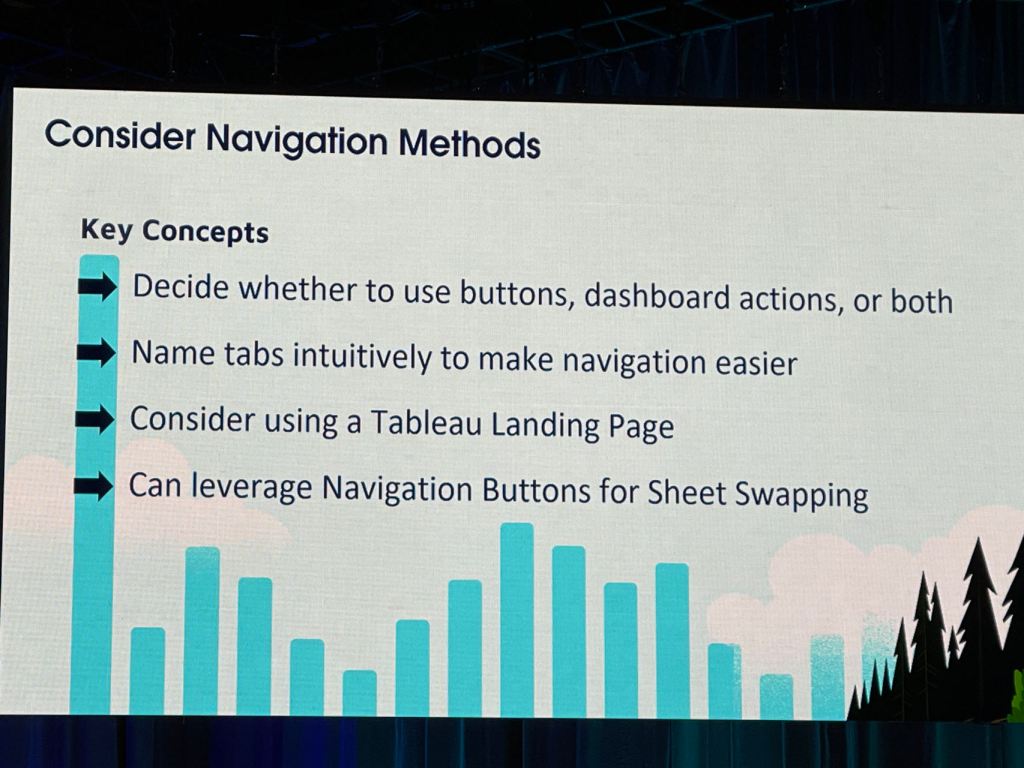
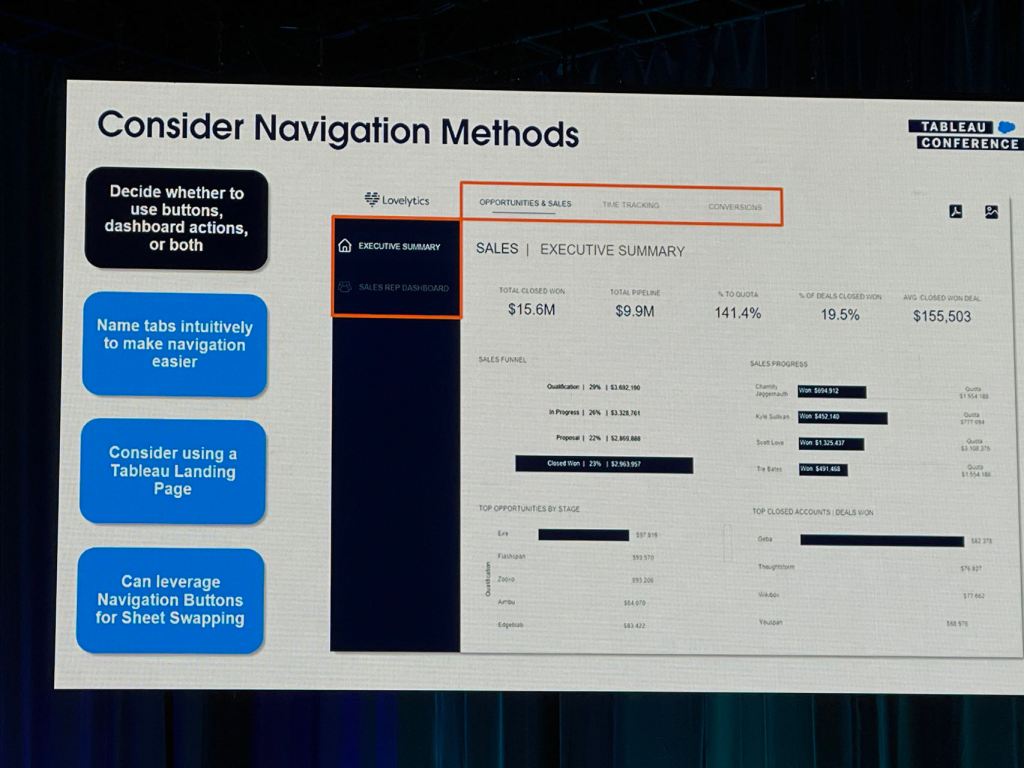
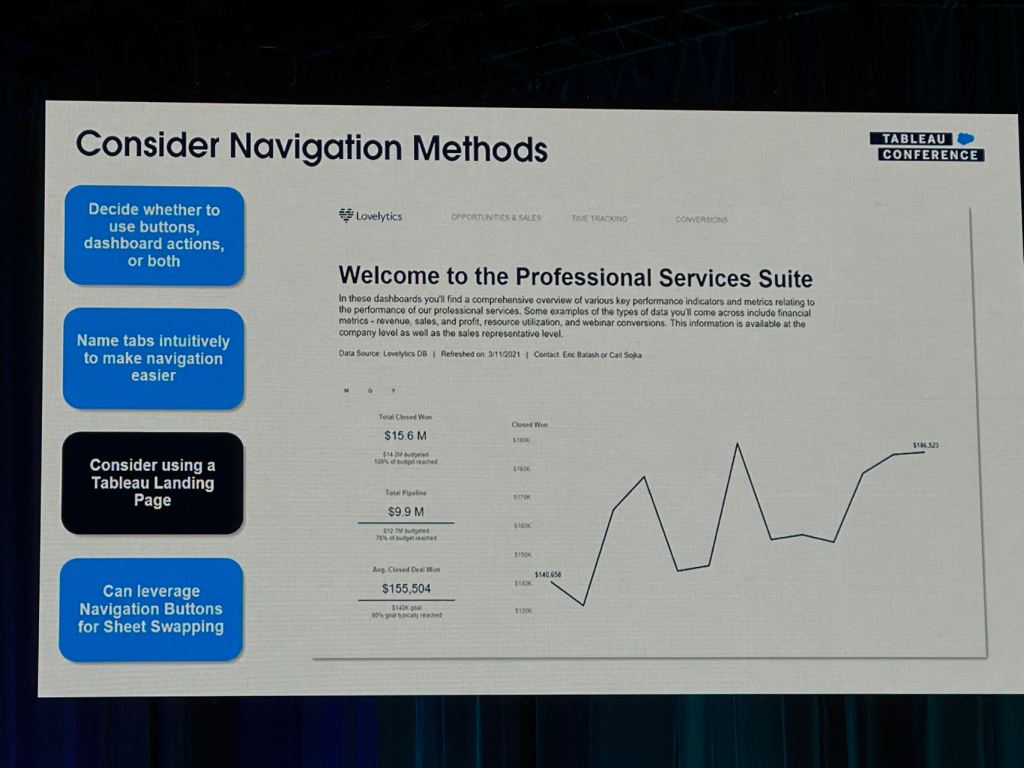
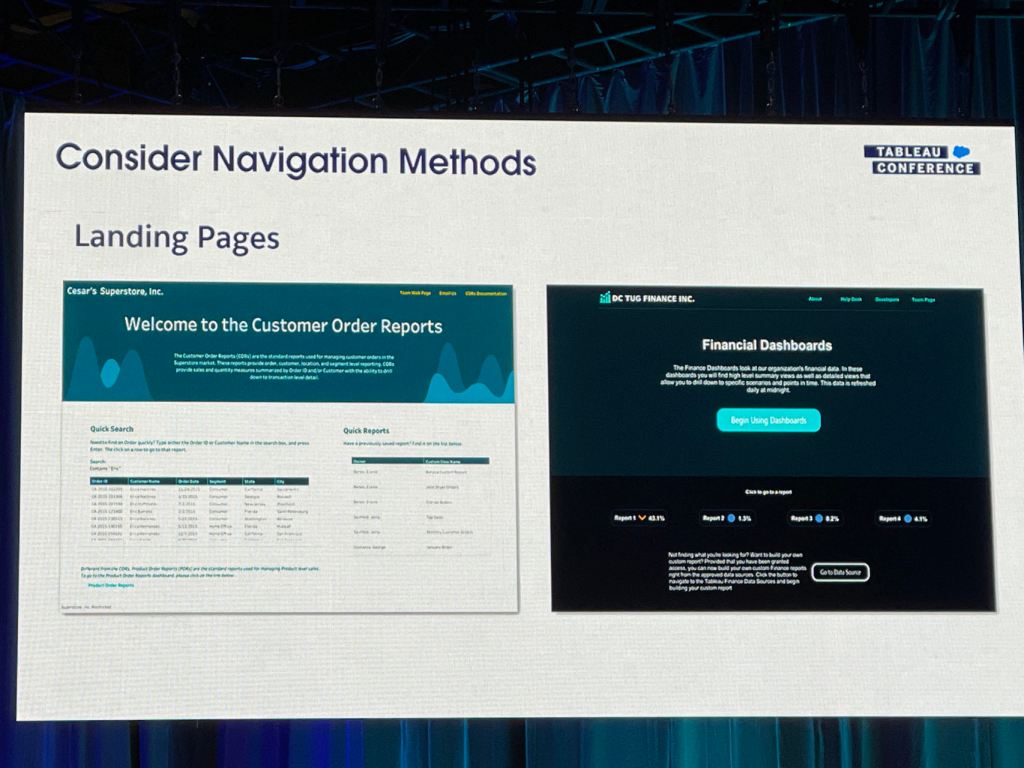
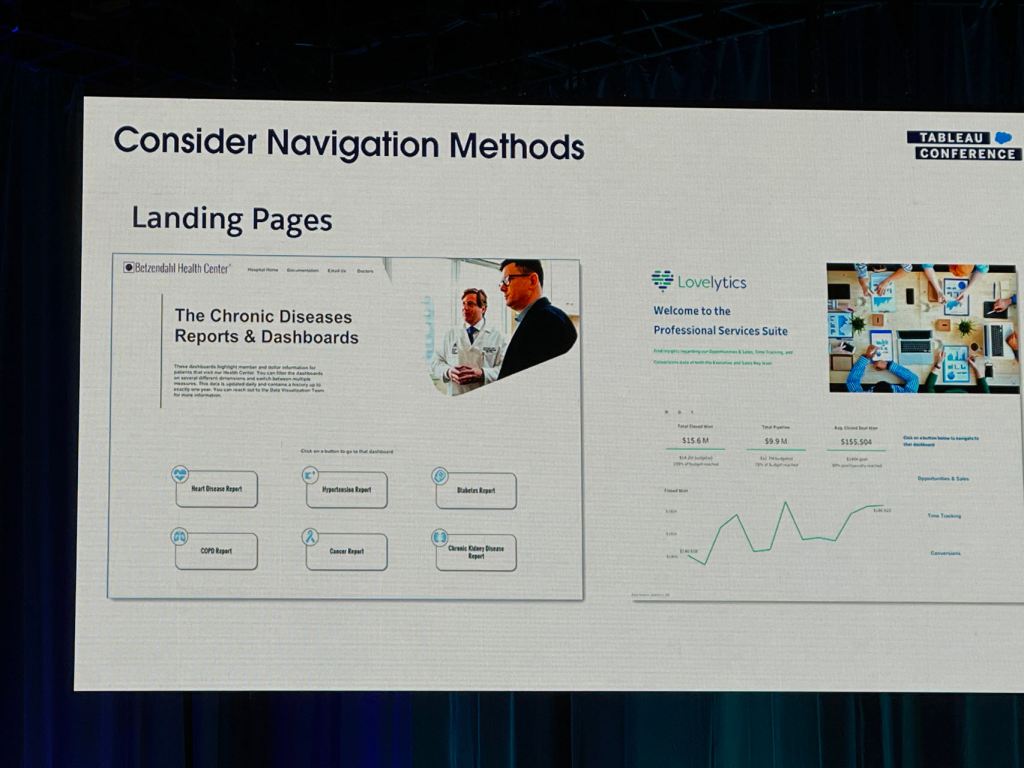

Parameter actions are widely used when implement navigations in the dashboard.
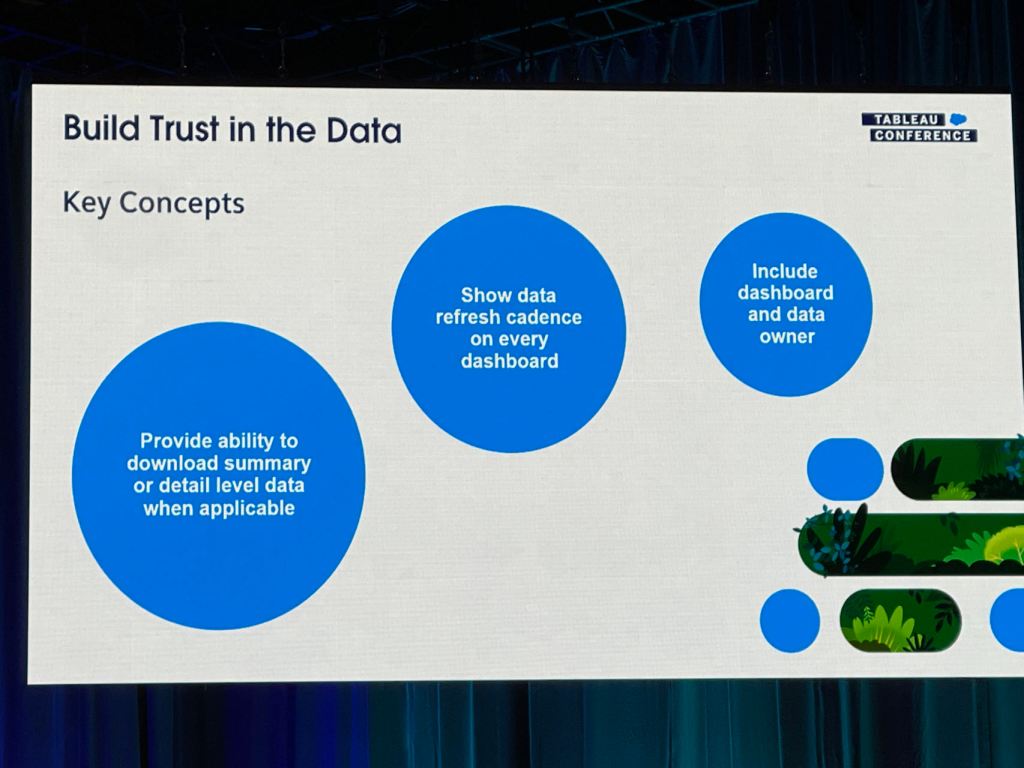
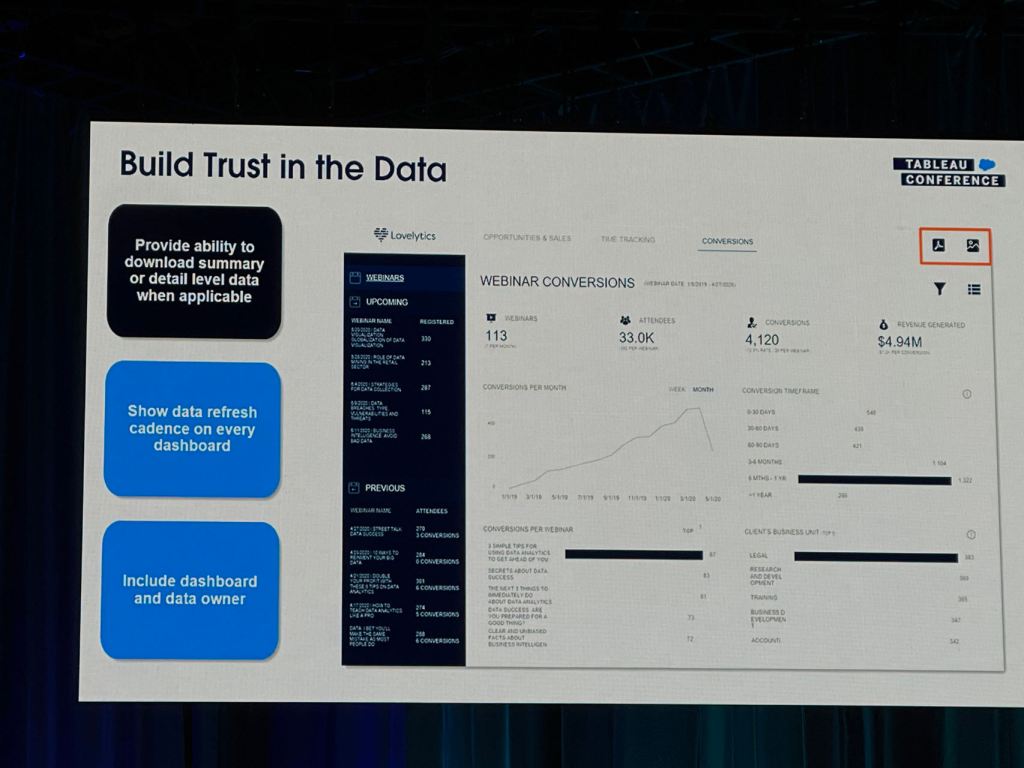
9. Build Trust In The Data
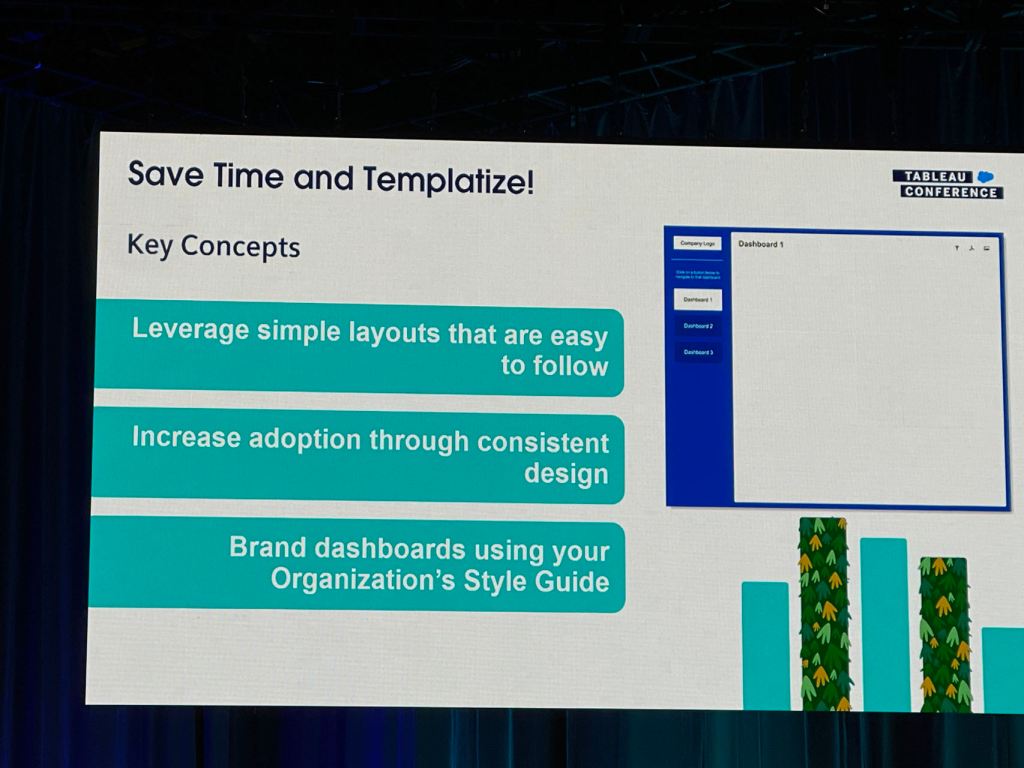
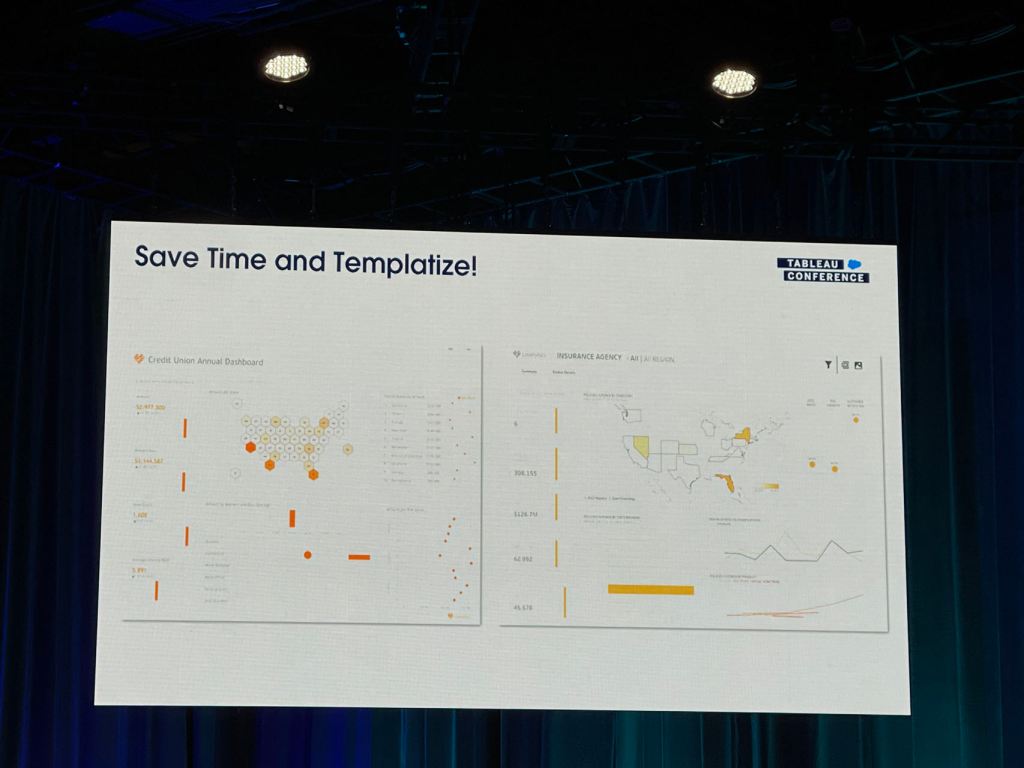
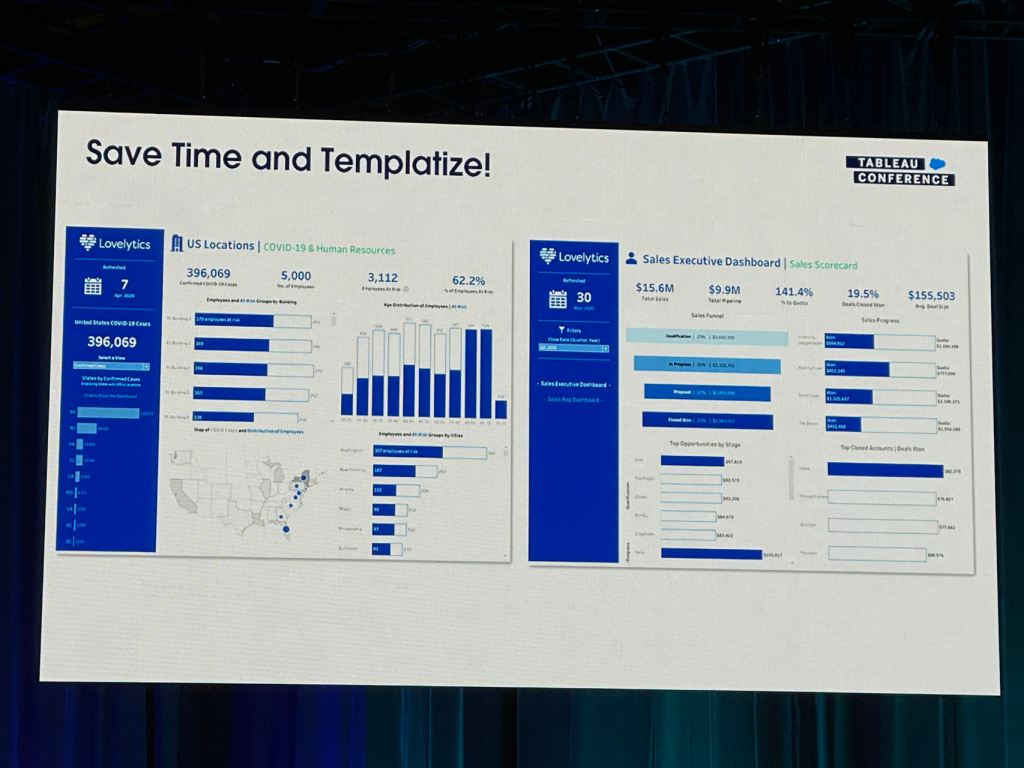
10. Save Time And Templatize
Summary