

Project Overview
A jewelry company would like to put in a bid to purchase a large set of diamonds. In this project, I will use the results from a predictive model to make a recommendation on how much the jewelry company should bid for the diamond.
Project Details
A diamond distributor decided to exit the market and hat put up a set of 3,000 diamonds up for auction. A jewelry company has shown interest in making a bid. The analytics team built a linear regression model using a large database of diamond prices to predict the price of a diamond based on its attributes. I will apply the model to make a recommendation for how much the company should bid for the entire set of 3,000 diamonds.
The linear regression model provides an equation that I can use to predict diamond prices for the set of 3,000 diamond:
Price = -5,269 + 8,413 x Carat + 158.1 x Cut + 454 x Clarity
Step 1 – Understand the Model
According to the model, if a diamond is 1 carat heavier than another with the same cut, how much more should I expect to pay? Why?
If a diamond is 1 carat heavier than another with the same cut and same clarity, the one additional carat result in an additional $8413 in price. The formula created by the regression determined that the coefficient for a carat is 8413, so far every increase in the number of carats the price will increase by the amount of the coefficient.
If you were interested in a 1.5 carat diamond with a Very Good cut (represented by a 3 in the model) and a VS2 clarity rating (represented by a 5 in the model), how much would the model predict you should pay for it?
The formula is price = -5269 + 8413 * Carat + 158.1 * Cut Ord + 454 * Clarity Ord
So now we can plug in the values for the different variables
Price = -5269 + 8413 * 1.5 + 158.1 * 3 + 454 * 5
Price = 10194.8
Step 2 – Visualize the Data
- Plot 1 – Plot the data for the diamonds in the database, with carat on the x-axis and price on the y-axis.
- Plot 2 – Plot the data for the diamonds for which you are predicting prices with carat on the x-axis and predicted price on the y-axis.
- Note: You can also plot both sets of data on the same chart in different colors.
- What strikes you about this comparison? After seeing this plot, do you feel confident in the model’s ability to predict prices?
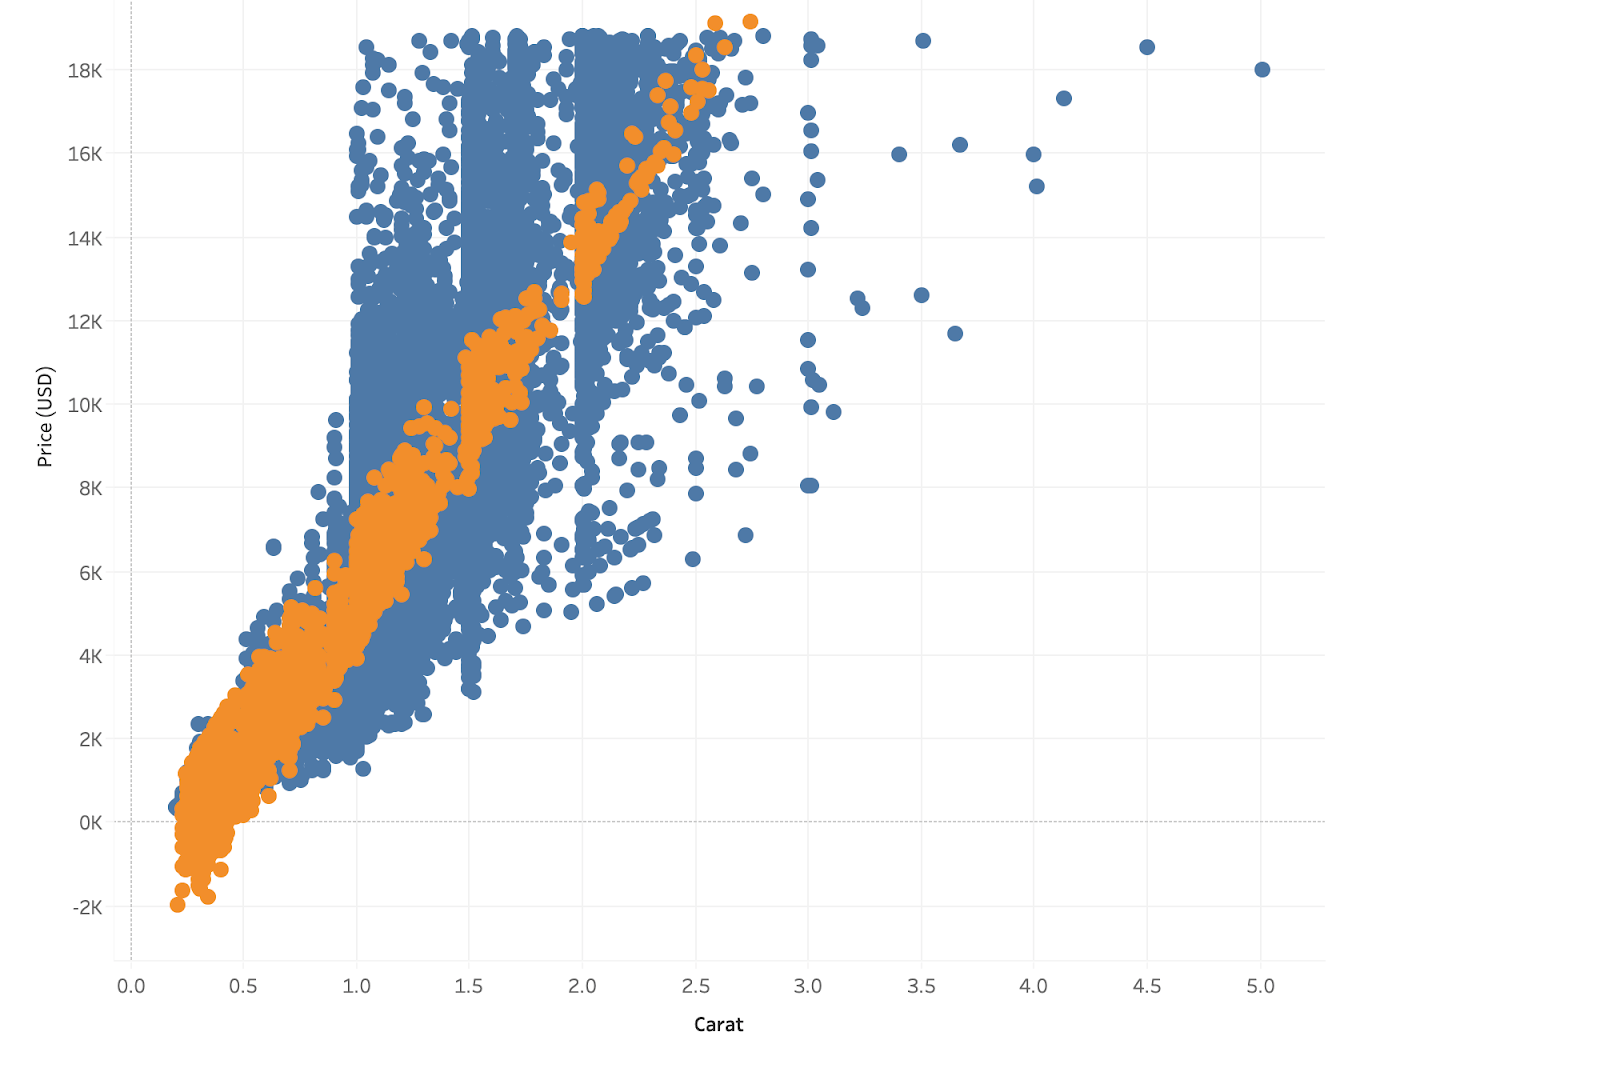
The predicted prices are directional and may not be reliable in some specific situations. Even though the model take carat, cut and clarity into account, there are more factors, such as shape and color, which will affect the price of the diamond as well.
By looking at the relationship between carat and price in the scatter plot above, the model predicts the prices ok on average, but it may be very off for certain diamonds. There appears to be an outlier diamond with only 1 carat but sold for $18,000+. Also you may see negative values in the graph, which the model does not take care of these situations. While the formula may not be accurate for an individual diamond, it should do a decent job at predicting the price we should pay for several diamonds at once since on average looks representative.
Step 3 – Make a Recommendation
What price do you recommend the jewelry company to bid? Please explain how you arrived at that number.
Regarding how much the company should bid for the entire set of 3,000 diamonds, I recommend a bit of $8,213,465.93. I arrive at this number by using a formula from the regression model provided that was based on previous diamond sales and applied it to the diamonds that were up for bid. Since the company generally purchases diamonds from distributors at 70% of that price, so I multiply the predicted amount $11,733,522.76 by 0.70 to get the final predicted bid of $8,213,465.93.
