
Tools used in this project: Alteryx and Tableau
Task 1: Determine Store Format for Existing Stores
Description: Your company currently has 85 grocery stores and is planning to open 10 new stores at the beginning of the year. Currently, all stores use the same store format for selling their products and has treated all stores similarly, shipping the same amount of product to each store. Some stores are suffering from product surpluses in some product categories and shortage in others. You need to provide analytical support to make decisions about store formats and inventory planning.
Methodology: Segmentation and Clustering
What’s the optimal number of store formats? How did you arrive at that number?
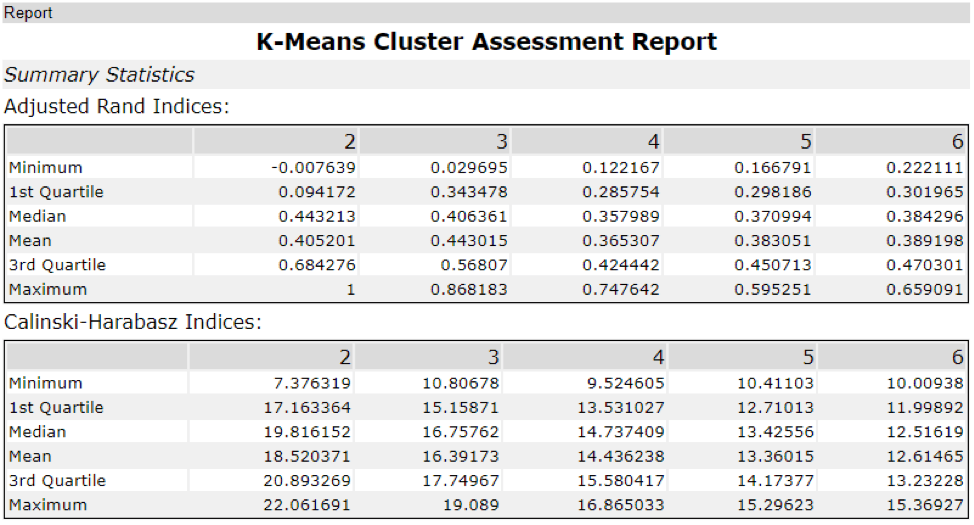
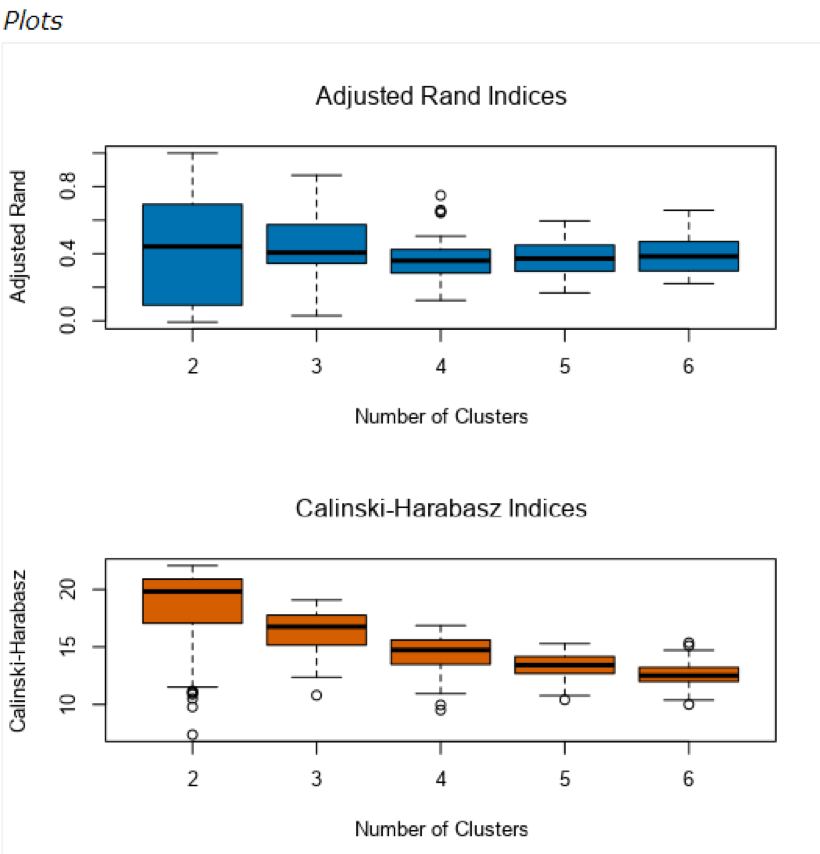
The optimal number of store formats is 3. I ran K-Means clustering model and used the median and spread of the Adjusted Rand Indices and Calinski-Harabasz Indices. It shows that 3 clusters are the optimal method because the box-whisker plots in the Adjusted Rand Indices show how tight the indices for each data point are within each other. Even though it looks like cluster 2 is the optimal number of clusters, it is actually 3 because the variance is too big for 2 clusters, while we see more compactness and still high median values when we have 3 clusters.
Model:
How many stores fall into each store format?
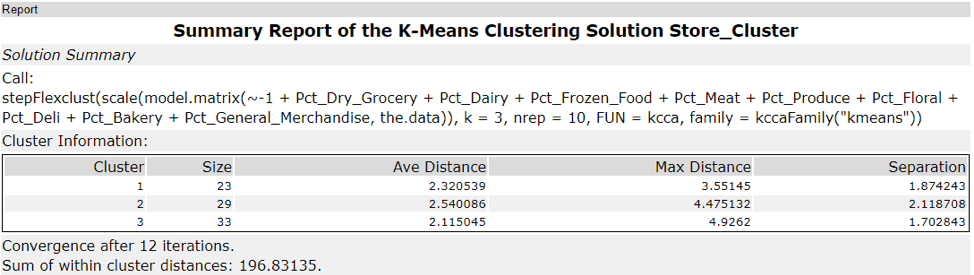
Cluster 1: 23 Stores
Cluster 2: 29 Stores
Cluster 3: 33 Stores
By running the K-Centroids Cluster Analysis tool using the same configuration that I came up with by K-Centroids Diagnostics tool, I am able to get the cluster information below:
Based on the results of the clustering model, what is one way that the clusters differ from one another?
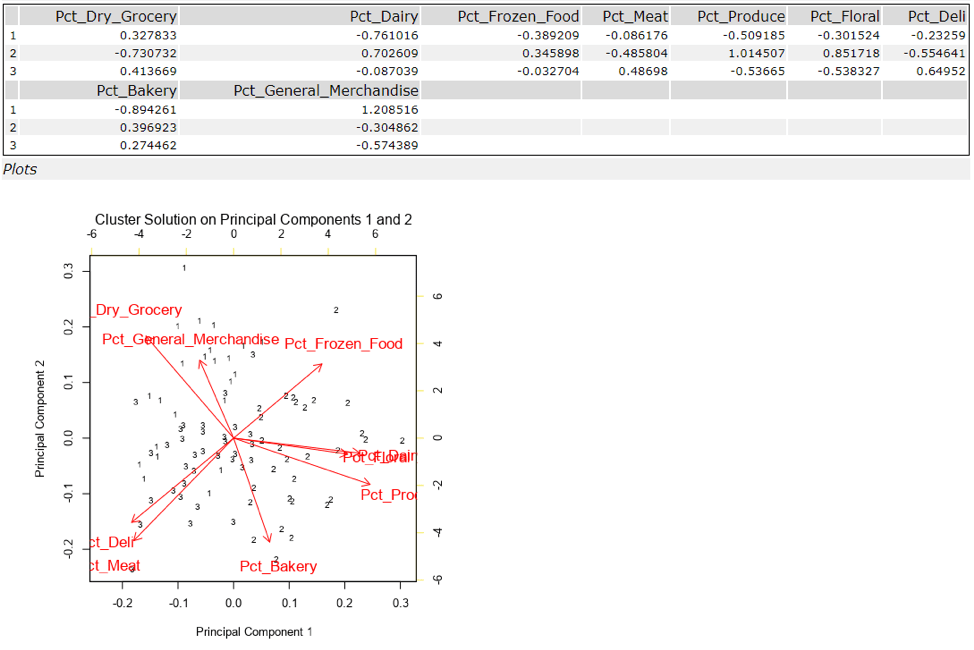
Based on the summary report of the K-Means Clustering solution, one way that the clusters differ from one another could be: considering the percentage of sales by category of each store, cluster 1 sells more in general merchandise; cluster 2 sells more in produce and floral; and cluster 3 sells more in deli and meat; etc.
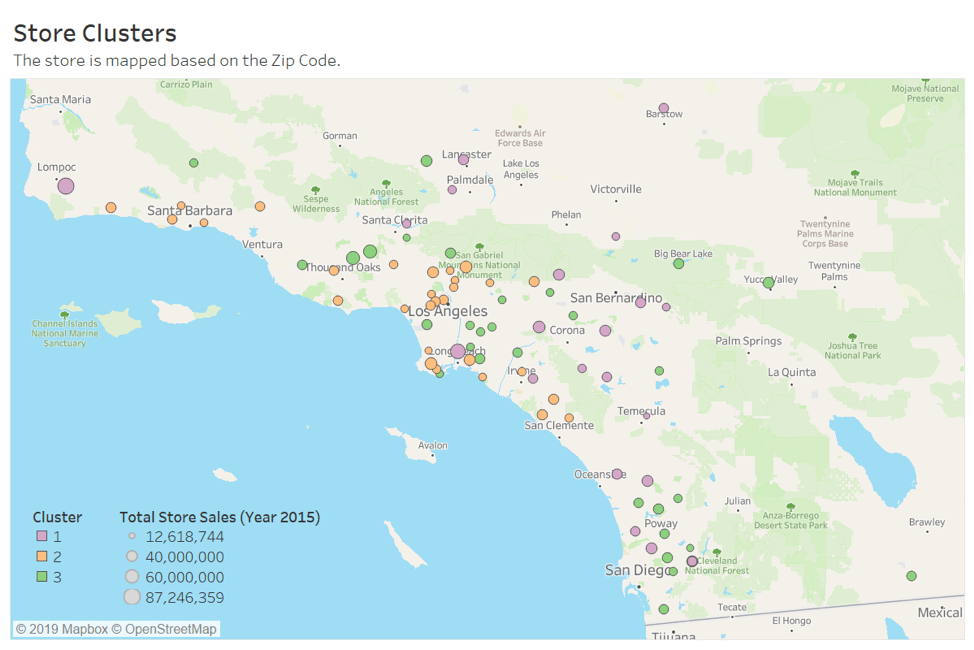
Please provide a Tableau visualization (saved as a Tableau Public file) that shows the location of the stores, uses color to show cluster, and size to show total sales.
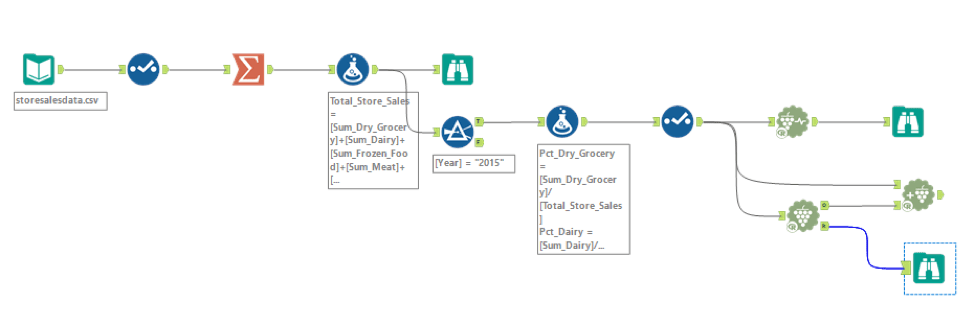
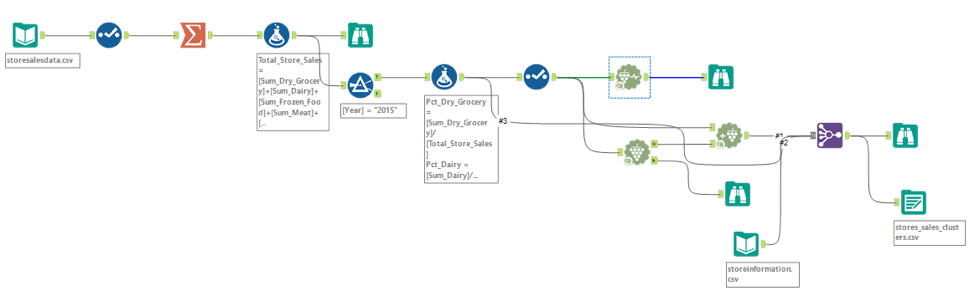
First, I ran the workflow to get the store sales data with clusters and address information which will be used as the data source of Tableau visualization.
Then connect Tableau to the data source and create the data visualization. Please see the visualization image downloaded from Tableau.
Task 2: Store Format for New Stores
Description: The grocery store chain has 10 new stores opening up at the beginning of the year. The company wants to determine which store format each of the new stores should have. However, we don’t have sales data for these new stores yet, so we’ll have to determine the format using each of the new store’s demographic data.
Methodology: Non-Binary Classification Models (Decision Tree, Forest Model, and Boosted Model)
What methodology did you use to predict the best store format form the new stores? Why did you choose that methodology? (Remember to Use a 20% validation sample with Random Seed = 3 to test differences in models.)
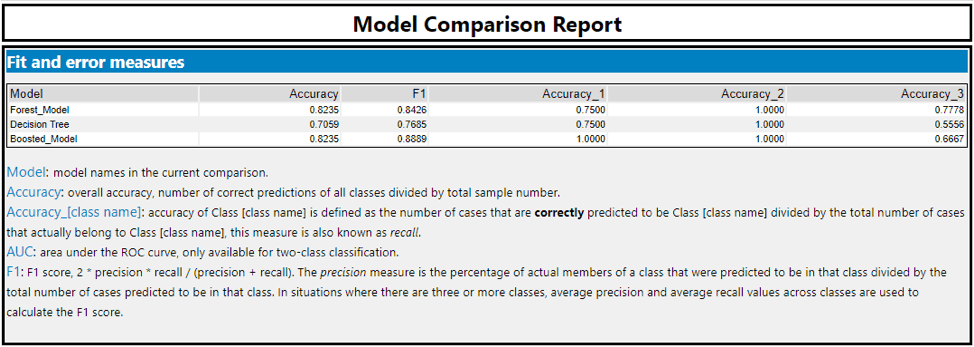
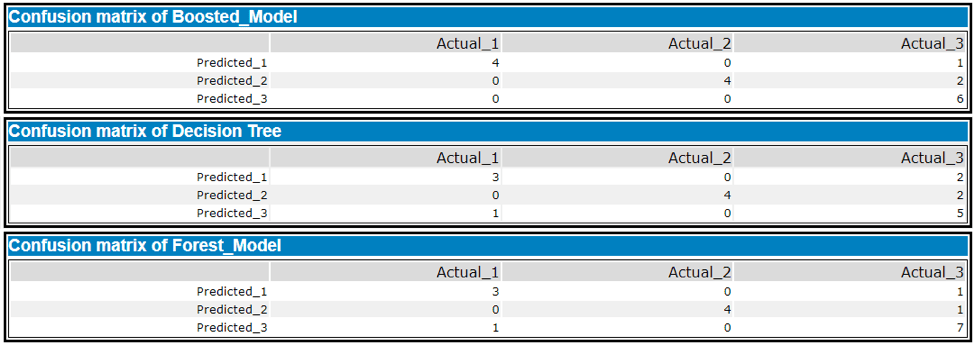
I used Boosted Model to predict the best store format for the new stores. I compared the Decision Tree, Forest Model and Boosted Model using the Model Comparison tool. Both Forest Model and Boosted Model have better accuracy than the Decision Tree. Boosted Model is the best because it has a higher F1 score.
What format do each of the 10 new stores fall into? Please fill in the table below.
| Store Number | Segment |
| S0086 | 3 |
| S0087 | 2 |
| S0088 | 1 |
| S0089 | 2 |
| S0090 | 2 |
| S0091 | 1 |
| S0092 | 2 |
| S0093 | 1 |
| S0094 | 2 |
| S0095 | 2 |
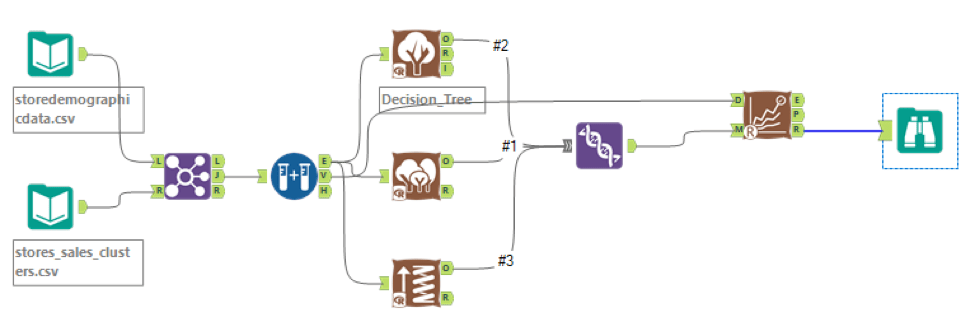
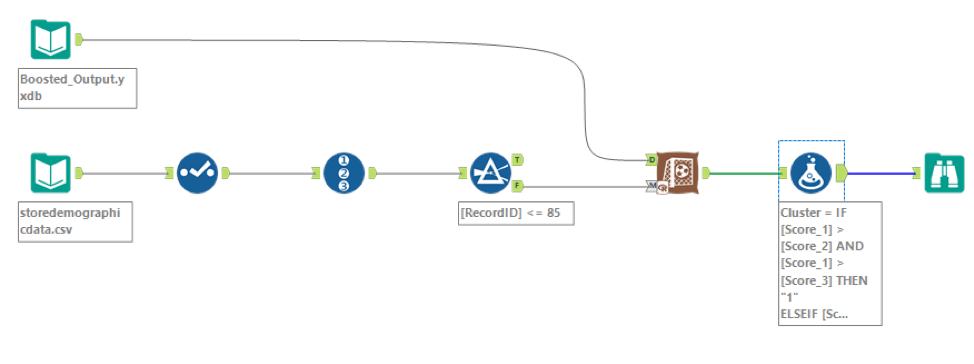
First I built out the Boosted Model and output the model object so that I can use in a new workflow.

Then I created a new workflow using the score tool.
- The input data sources are the data output from Boosted Model that I mentioned above and the new stores (S0086 – S0095).
- To get the new stores, I used the Record ID tool to filter out the Record ID <= 85 and the rest are the new stores.
- After the Score tool, I used the Formula tool to come up with the predicted cluster for each store:
- IF [Score_1] > [Score_2] AND [Score_1] > [Score_3] THEN “1 ELSEIF [Score_2] > [Score_1] AND [Score_2] > [Score_3] THEN “2” ELSE “3” ENDIF
- Ultimately, there are 3 stores in cluster 1, 6 stores in cluster 2 and 1 store in cluster 3.
Task 3: Forecasting Produce Sales
Description: You’ve been asked to prepare a monthly forecast for produce sales for the full year of 2016 for both existing and new stores. To do so, follow the steps below.
Methodology: Time Series Forecasting (ETS Models and ARIMA Models)
What type of ETS or ARIMA model did you use for each forecast? Use ETS(a,m,n) or ARIMA(ar, i, ma) notation. How did you come to that decision?
ETS(M,N,M) is the model that I selected to forecast the produce sales for new and existing stores. Here is how I came up with the decision:
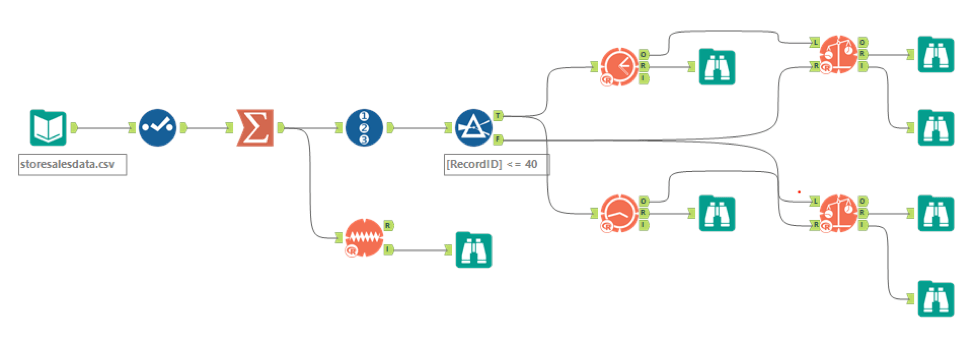
- Use storesalesdata file as the data source. Add a Summarize tool to sum the produce sales (data type: double) group by year and month.
- Then from the 46 records, filter the last 6 records as a holdout sample. I use the first 40 records to train the models.
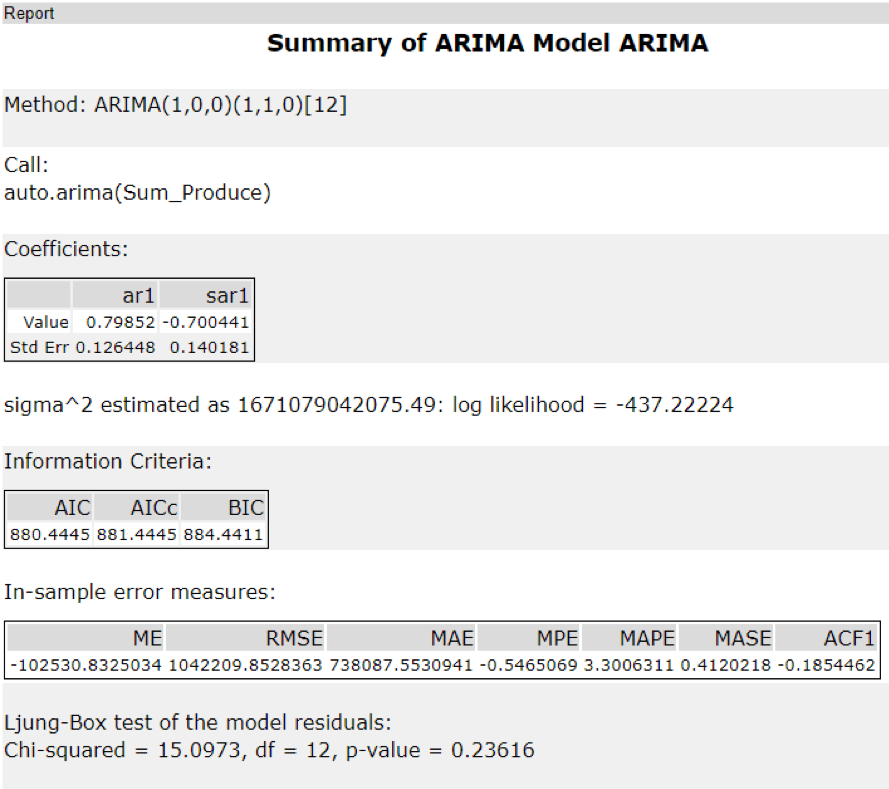
- Train ETS and ARIMA models. The optimal option for ETS model is ETS(M,N,M) and for ARIMA is ARIMA(1,0,0)(1,1,0)[12].
- Add TS Compare tool to obtain the forecast error measurements against the holdout sample for each model.
- Compare the forecast error measurements against the holdout sample of ETS and ARIMA and select the model with the lower forecast error measurements. ETS(M,N,M) turns out to be the better one. Please see the error measures comparison below (screenshots):
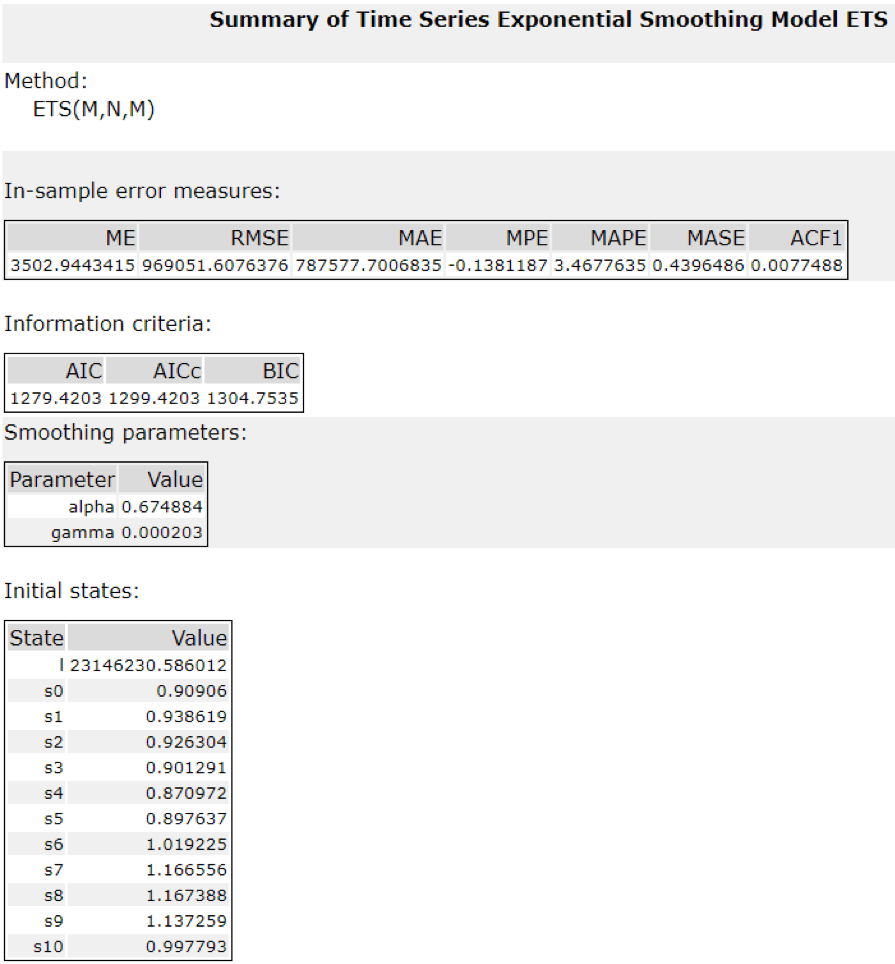
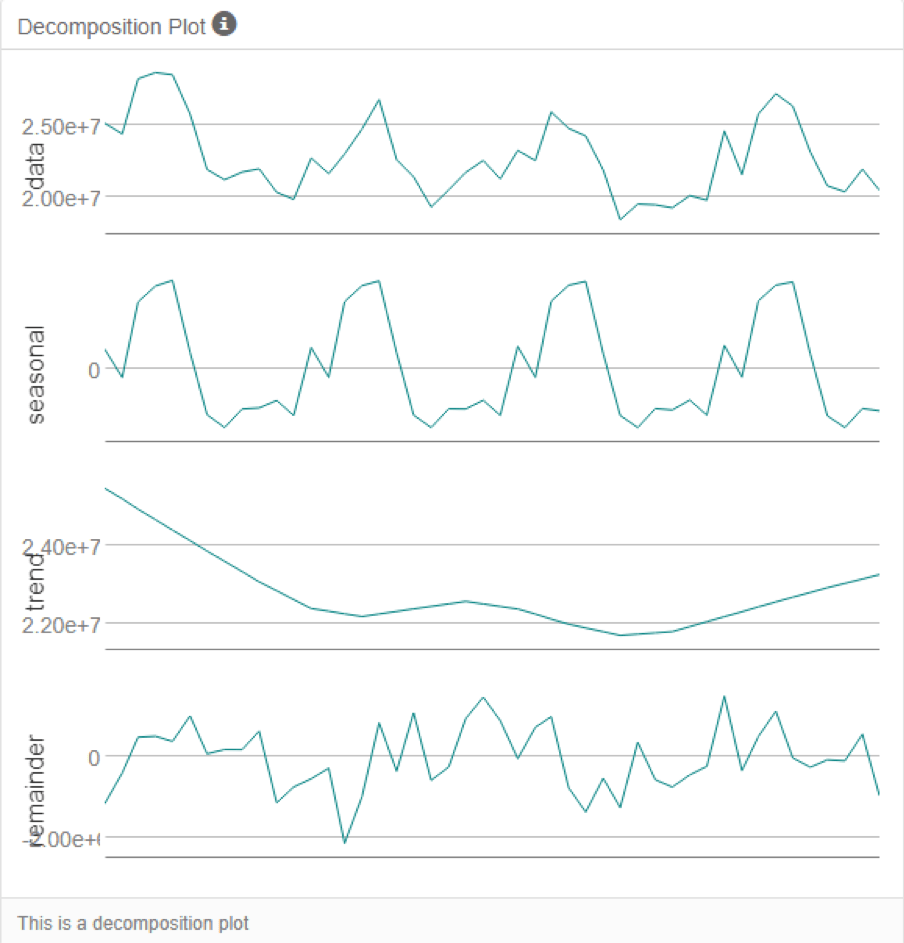
- Also based on the decomposition plot obtained from the TS Plot tool, we know the error is multiplicative, the trend is none and the seasonality is multiplicative, so ETS(M,N,M) is the best model that I should choose to forecast the produce sales for the new and existing store.
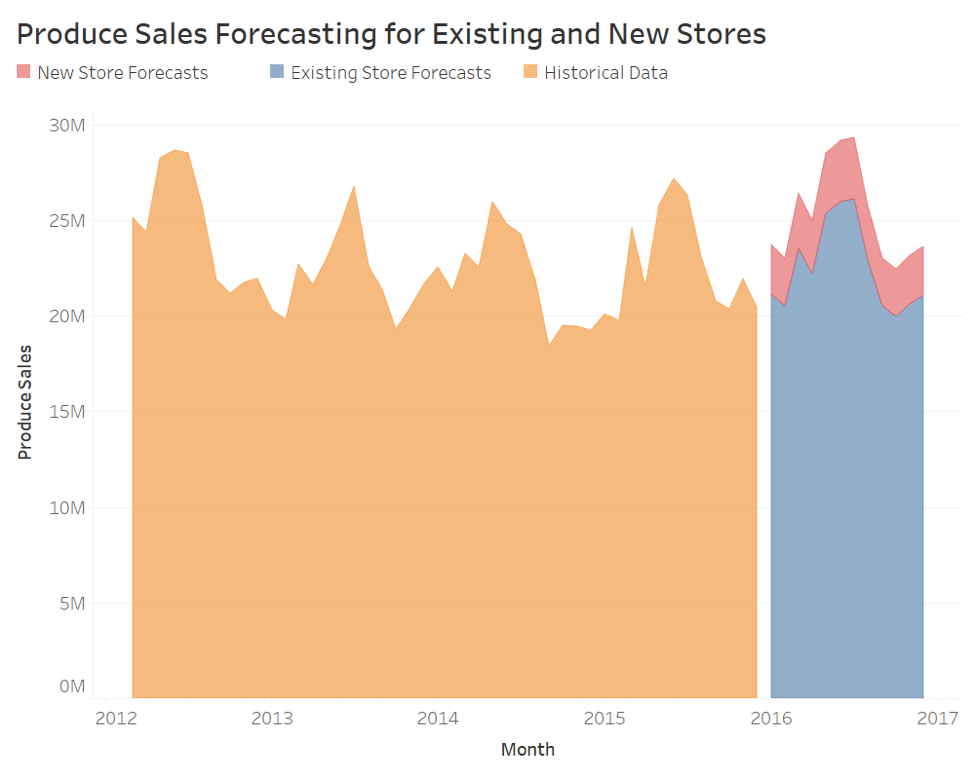
Please provide a table of your forecasts for existing and new stores. Also, provide visualization of your forecasts that includes historical data, existing stores forecasts, and new stores forecasts.
| Month | New Stores | Existing Store |
| 2016-01 | 2,588,250 | 21,136,642 |
| 2016-02 | 2,499,159 | 20,507,039 |
| 2016-03 | 2,916,908 | 23,506,566 |
| 2016-04 | 2,791,560 | 22,208,406 |
| 2016-05 | 3,156,890 | 25,380,148 |
| 2016-06 | 3,200,940 | 25,966,799 |
| 2016-07 | 3,224,858 | 26,113,793 |
| 2016-08 | 2,861,958 | 22,899,286 |
| 2016-09 | 2,534,353 | 20,499,584 |
| 2016-10 | 2,481,117 | 19,971,243 |
| 2016-11 | 2,578,336 | 20,602,666 |
| 2016-12 | 2,561,917 | 21,073,222 |
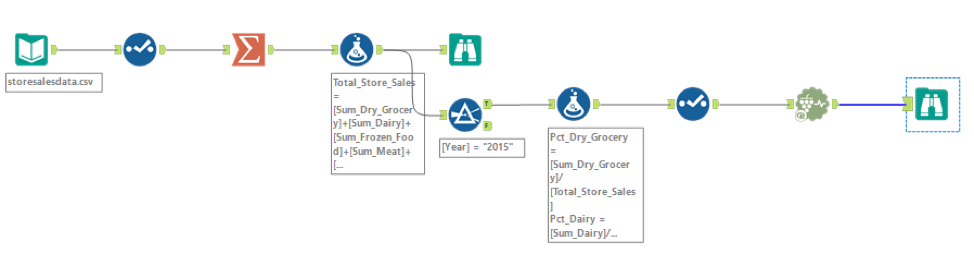
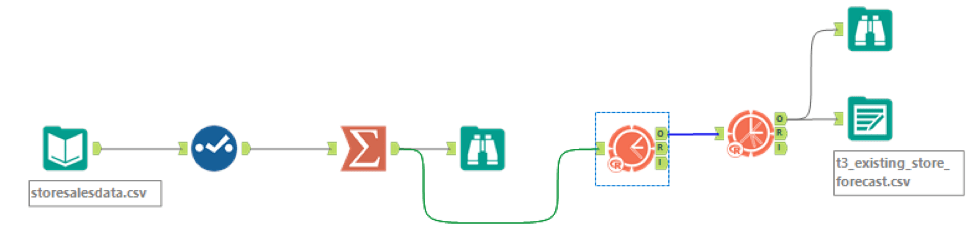
Here is the workflow that I built for existing stores forecasting:
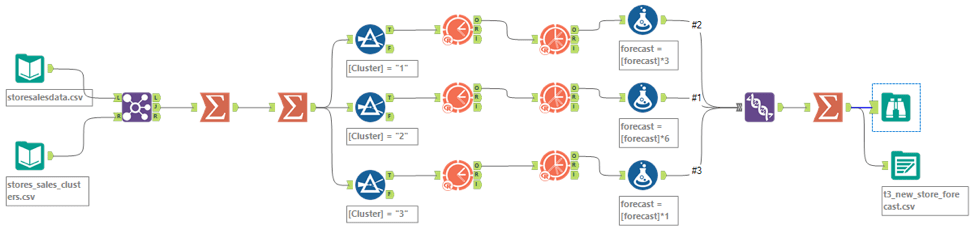
Here is the workflow that I build for new stores forecasting:
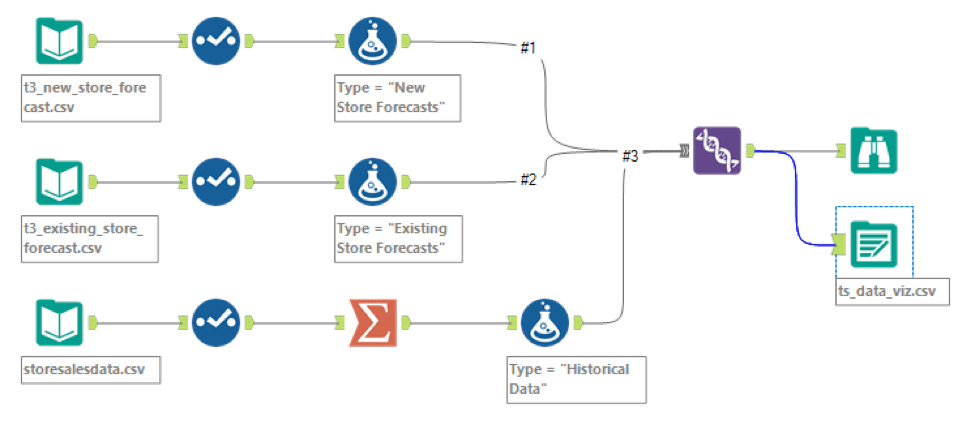
I created another workflow to union historical data, existing store forecasts and new store forecasts to use in Tableau.
Below please find the data visualization of my forecasts that includes historical data, existing stores forecasts, and new stores forecasts.