
Topic: Data Wrangling | Tool: Alteryx
The Business Problem: Pawdicity is a pet store chain in Wyoming with 13 stores throughout the state. This year, Pawdacity is going to open the 14th store. Your manager asked you to perform an analysis to recommend the city for Pawdacity’s nearest store based on the predicted yearly sales. This project will only include the first part: data cleaning which needs to first format and blend together data from different datasets and deal with outliers.
Step 1: Business and Data Understanding
What decisions need to be made?
Pawdacity, which is a leading pet store chain in Wyoming with 13 stores, would like to expand and open a 14th store. We need to perform analysis to recommend the city for Pawdacity’s newest store based on predicted yearly sales.
What data is needed to inform those decisions?
The data sources to work with:
- The monthly sales data for all of the Pawdacity stores for the year 2010.
- NAICS data on the most current sales of all competitor stores where total sales is equal to 12 months of sales.
- A partially parsed data file that can be used for population numbers.
- Demographic data for each city and county in the state of Wyoming.
Using the data source above, I need to create a dataset with the following columns to inform the decisions that we want to make.
- City
- 2010 Census Population
- Total Pawdacity Sales
- Households with Under 18
- Land Area
- Population Density
- Total Families
Step 2: Building the Training Set
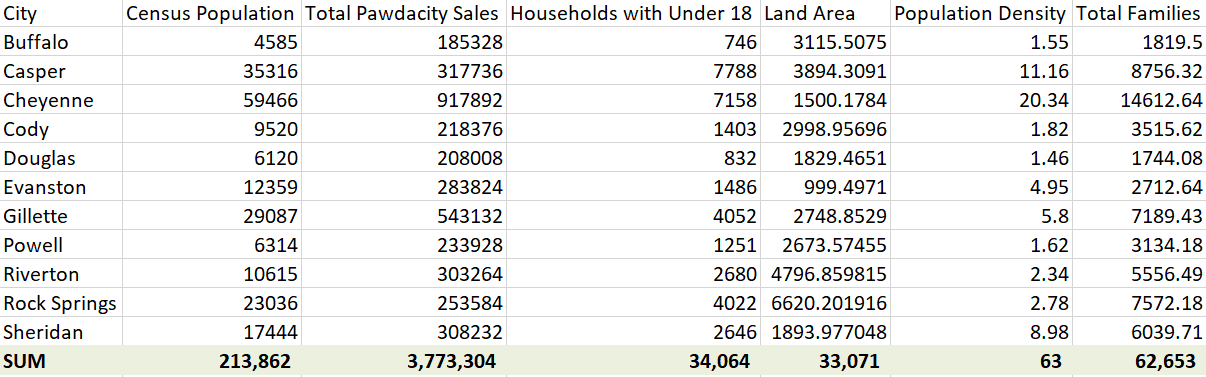
Build your training set given the data provided to you. Your column sums of your dataset should match the sums in the table below. In addition provide the averages on your data set here to help reviewers check your work. You should round up to two decimal places, ex: 1.24
Based on the workflow that I created in Alteryx, my column sums of my dataset match the sums in the table below. The screenshot below shows the 11 cities that I get after cleaning the data and the SUM of each metric is at the bottom.
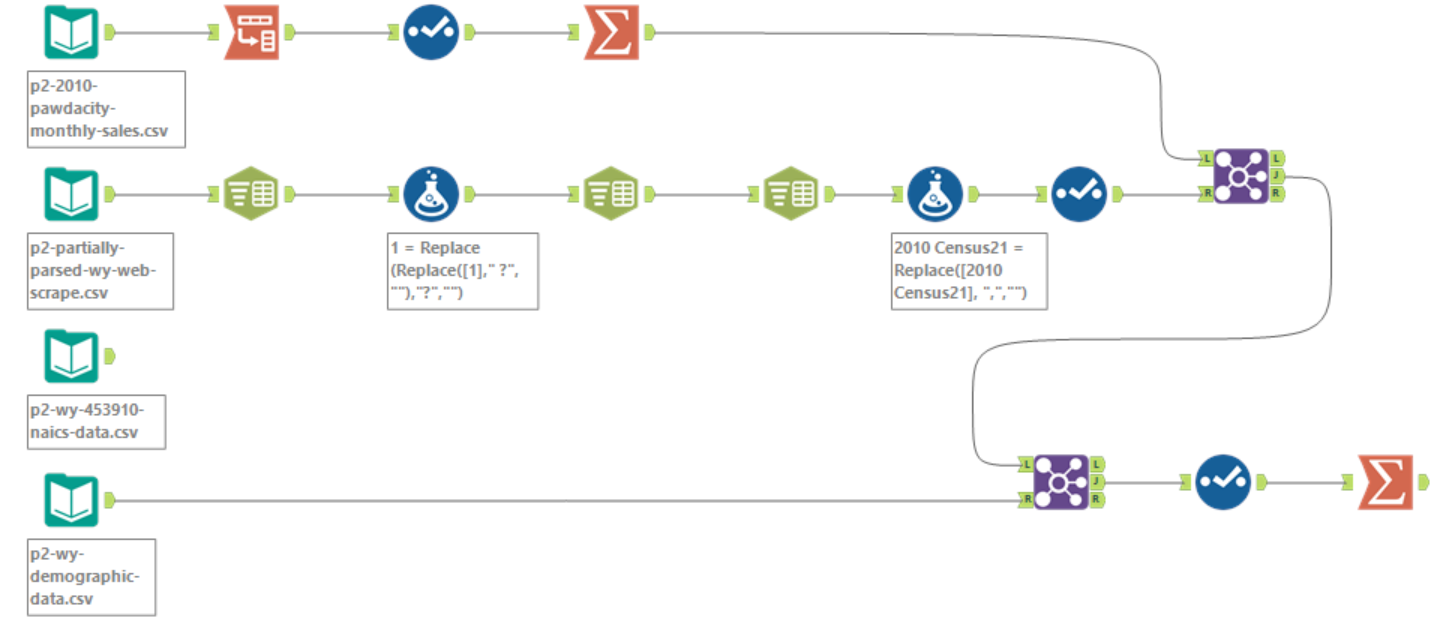
Here is my Alteryx workflow for reference.
Also, I came up with the Average metrics and filled in the table below.
| Column | Sum | Average |
| Census Population | 213,862 | 19,442 |
| Total Pawdacity Sales | 3,773,304 | 343,027.64 |
| Households with Under 18 | 34,064 | 3,096.73 |
| Land Area | 33,071 | 3,006.49 |
| Population Density | 63 | 5.71 |
| Total Families | 62,653 | 5,695.71 |
Step 3: Dealing with Outliers
Are there any cities that are outliers in the training set? Which outlier have you chosen to remove or impute? Because this dataset is a small data set (11 cities), you should only remove or impute one outlier. Please explain your reasoning.
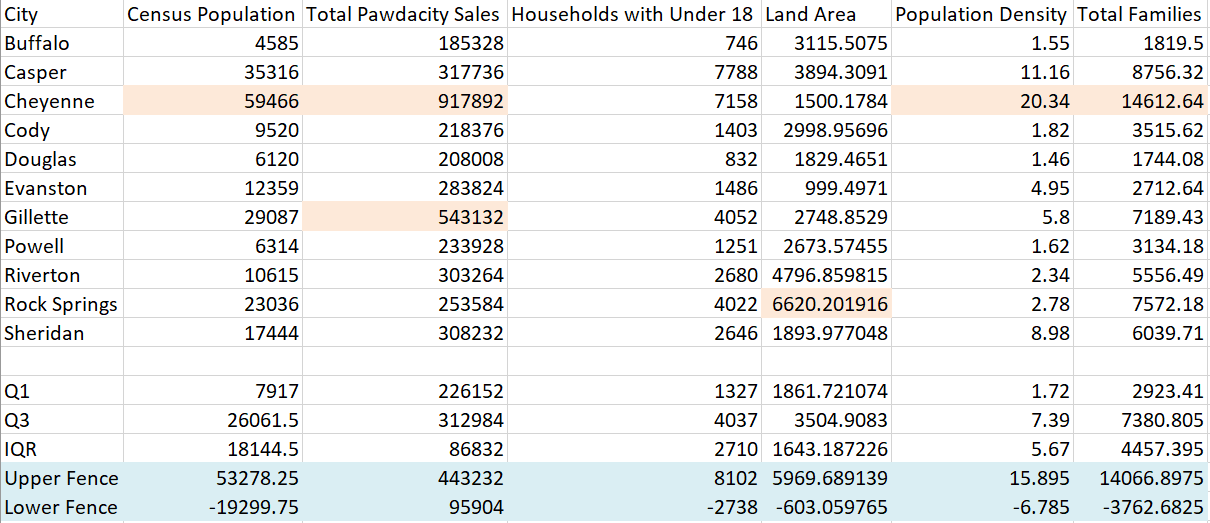
To identify the outlier, I first calculate the upper fence and the lower fence for each metric. Here is what I did:
- Calculate 1st quartile Q1 and 3rd quartile Q3 of the dataset. I use the Excel function QUARTILE.INC.
- Calculate the Interquartile Range: IQR = Q3 – Q1
- Add 1.5 * IQR to Q3 to get the upper fence: Upper Fence = Q3 + 1.5 * IQR
- Subtract 1.5 * IQR to Q1 to get the lower fence: Lower Fence = Q1 – 1.5 * IQR
- Compare each value with upper fence and lower fence. The ones that are not in the range are outliers.
As we can see below, I highlight the values out of lower fence and upper fence range. Cities Cheyenne, Gillette, and Rock Springs are outliers.
Since Gillette and Rock Springs are pretty close to the upper fence and we only have 11 cities, we should only remove Cheyenne.
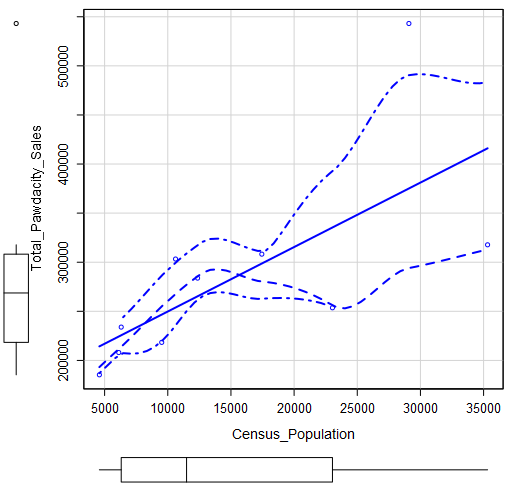
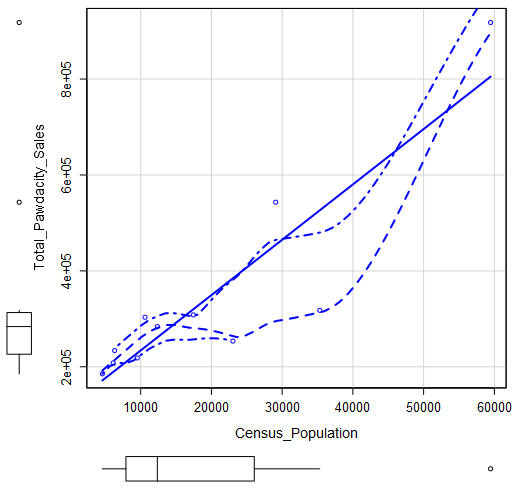
Just for reference, I plot Census Population vs. Total Pawdacity Sales before and after removing the outlier. We can visually see that the outlier did affect the slope a lot.
Scatter Plot: Census Population vs. Total Pawdacity Sales
Remove outlier Cheyenne. Scatter Plot: Census Population vs. Total Pawdacity Sales