
Topic: Classification Model | Tool: Alteryx
Step 1: Business and Data Understanding
What decisions need to be made?
A small bank which typically get 200 loan applications per week and approved by hand suddenly received nearly 500 loan applications due to a financial scandal that hit a competitive bank last week. As a loan officer, my manager wants me to figure out how to process all of these loan applications within one week. Based on the classification models that I learned recently, I need to systematically evaluate the creditworthiness of these new loan applicants and provide a list of creditworthy customers to my manager in the next two days.
What data is needed to inform those decisions?
- Data on all past applications
- The list of customers that need to be processed in the next few days
What kind of model (Continuous, Binary, Non-Binary, Time-Series) do we need to use to help make these decisions?
We need to use the Binary model to help make these decisions because we want to identify people who quality and do not quality for loans for this problem.
Step 2: Building the Training Set
Here are some guidelines to help guide your data cleanup:
- For numerical data fields, are there any fields that highly-correlate with each other? The correlation should be at least .70 to be considered “high”.
- Are there any missing data for each of the data fields? Fields with a lot of missing data should be removed
- Are there only a few values in a subset of your data field? Does the data field look very uniform (there is only one value for the entire field?). This is called “low variability” and you should remove fields that have low variability. Refer to the “Tips” section to find examples of data fields with low-variability.
- Your clean data set should have 13 columns where the Average of Age Years should be 36 (rounded up)
Note: For the sake of consistency in the data cleanup process, impute data using the median of the entire data field instead of removing a few data points.
Note: For students using software other than Alteryx, please format each variable as:
| Variable | Data Type |
| Credit-Application-Result | String |
| Account-Balance | String |
| Duration-of-Credit-Month | Double |
| Payment-Status-of-Previous-Credit | String |
| Purpose | String |
| Credit-Amount | Double |
| Value-Savings-Stocks | String |
| Length-of-current-employment | String |
| Instalment-per-cent | Double |
| Guarantors | String |
| Duration-in-Current-address | Double |
| Most-valuable-available-asset | Double |
| Age-years | Double |
| Concurrent-Credits | String |
| Type-of-apartment | Double |
| No-of-Credits-at-this-Bank | String |
| Occupation | Double |
| No-of-dependents | Double |
| Telephone | Double |
| Foreign-Worker | Double |
To achieve consistent results reviewers expect. Answer this question: In your cleanup process, which fields did you remove or impute? Please justify why you removed or imputed these fields. Visualizations are encouraged.
In summary, I will
- impute Age-years and
- remove Duration-in-Current-address, Occupation, Concurrent-Credits, Guarantors, Foreign-Worker, No-of-dependents, and Telephone.
I Identified the missing data and low variability fields using Field Summary tool and browsing the report output and interactive output. Please see more details below:

Missing Data:
Age-years field has 2.4% data missing. By using the Field Summary tool and browsing the report output, I got the result below (see screenshot). I will impute the data using the median of the entire data field according to the suggestion in the project details.

Duration-in-Current-address field has 68.8% data missing, which should be removed.

Low Variability – the data is entirely uniform and there is no other variations of the data:
Occupation field only has one value “1”

Concurrent-Credits field only has one value “Other Banks/Depts” (500 instances)

Low Variability – data field heavily skew towards one type of data:
Guarantors: the histograph of this variable shows that the majority of the data is skewed toward “None”.

Foreign-Worker: the histograph of this variable shows that the majority of the data is skewed toward “1”.

No-of-dependents: the histograph of this variable shows that the majority of the data is skewed toward “1”.

Telephone field should be removed as well because it can not tell us anything about the creditworthiness of the applicant.
Step 3: Train your Classification Models
First, create your Estimation and Validation samples where 70% of your dataset should go to Estimation and 30% of your entire dataset should be reserved for Validation. Set the Random Seed to 1.
Create all of the following models: Logistic Regression, Decision Tree, Forest Model, Boosted Model.
Answer these questions for each model you created:
- Which predictor variables are significant or the most important? Please show the p-values or variable importance charts for all of your predictor variables.
- Validate your model against the Validation set. What was the overall percent accuracy? Show the confusion matrix. Are there any bias seen in the model’s predictions?
You should have four sets of questions answered.
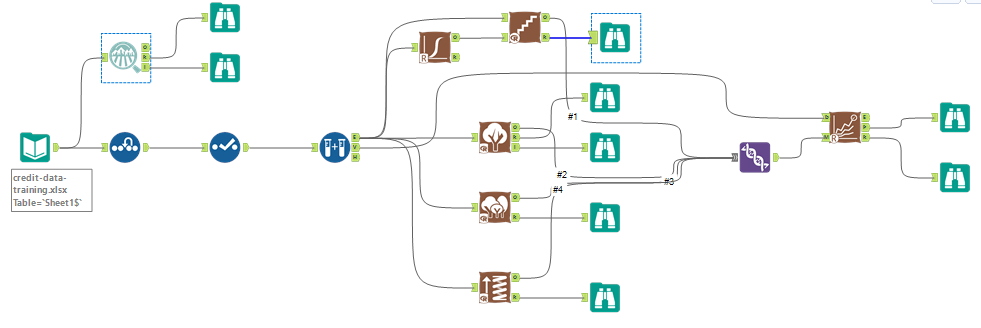
First, I built 4 models in Alteryx and used the model comparison tool to validate these models:
- Logistic Stepwise
- Decision Tree
- Forest Model
- Boosted Model
Significant Predictive Variables:
Logistic Stepwise: based on the report below, the significant predictive variables are Account Balance, Payment Status of Previous Credit, Purpose, Credit Amount, Length of Current Employment, and Installment per Cent.

Decision Tree: based on the variable importance report below, the top 3 predictive variables are Account Balance, Value Savings Stocks, and Duration of Credit Month.

Forest Model: based on the variable importance plot below, the top 3 predictive variables are Credit Amount, Age Years, and Duration of Credit Month.

Boosted Model: based on the variable importance plot, the top 3 important predictive variables are Credit Amount, Amount Balance, and Duration of Credit Month.

Validate and compare models:
I used the model comparison tool to validate and compare the accuracy of these four models:

Based on the model comparison report above, the overall accuracy for Logistic Stepwise model is 0.7600; the overall accuracy for Decision Tree is 0.7467; the overall accuracy for Forest Model is 0.8000; and the overall accuracy for Boosted Model is 0.7867.
Below please find the confusion matrix for all these models:

In our case, we have an imbalanced dataset. There are a lot more creditworthy applicants than non-creditworthy. To be able to select a model for prediction we are interested in the overall accuracy and the Positive Predictive value (Precision) and Negative Predictive value and F1 score to determine the best model.


We might say that whose models are biased towards predicting individuals who are creditworthy, as they do not predict individuals who are not creditworthy nearly at the same level as those who are.
Step 4: Writeup
Decide on the best model and score your new customers. For reviewing consistency, if Score_Creditworthy is greater than Score_NonCreditworthy, the person should be labeled as “Creditworthy”
Write a brief report on how you came up with your classification model and write down how many of the new customers would qualify for a loan.
Which model did you choose to use? Please justify your decision using all of the following techniques. Please only use these techniques to justify your decision:
- Overall Accuracy against your Validation set
- Accuracies within “Creditworthy” and “Non-Creditworthy” segments
- ROC graph
- Bias in the Confusion Matrices
Note: Remember that your boss only cares about prediction accuracy for Creditworthy and Non-Creditworthy segments.
How many individuals are creditworthy?
I decided to use Forest model considering overall accuracy, PPV, NPV and the F1 score. We want to max values on all of them because they describe the predictive power of the model. The higher the values are, the more accurate the model is.
Model Comparison Report for Accuracy:
Accuracies within “Creditworthy” and “Non-Creditworthy” segments:
ROC Graph:

Bias was already explained in the previous section.
To come up with the number of applicants who are creditworthy, I built the model below:


Ultimately, I got 406 individuals who are creditworthy.
